Fig. 5
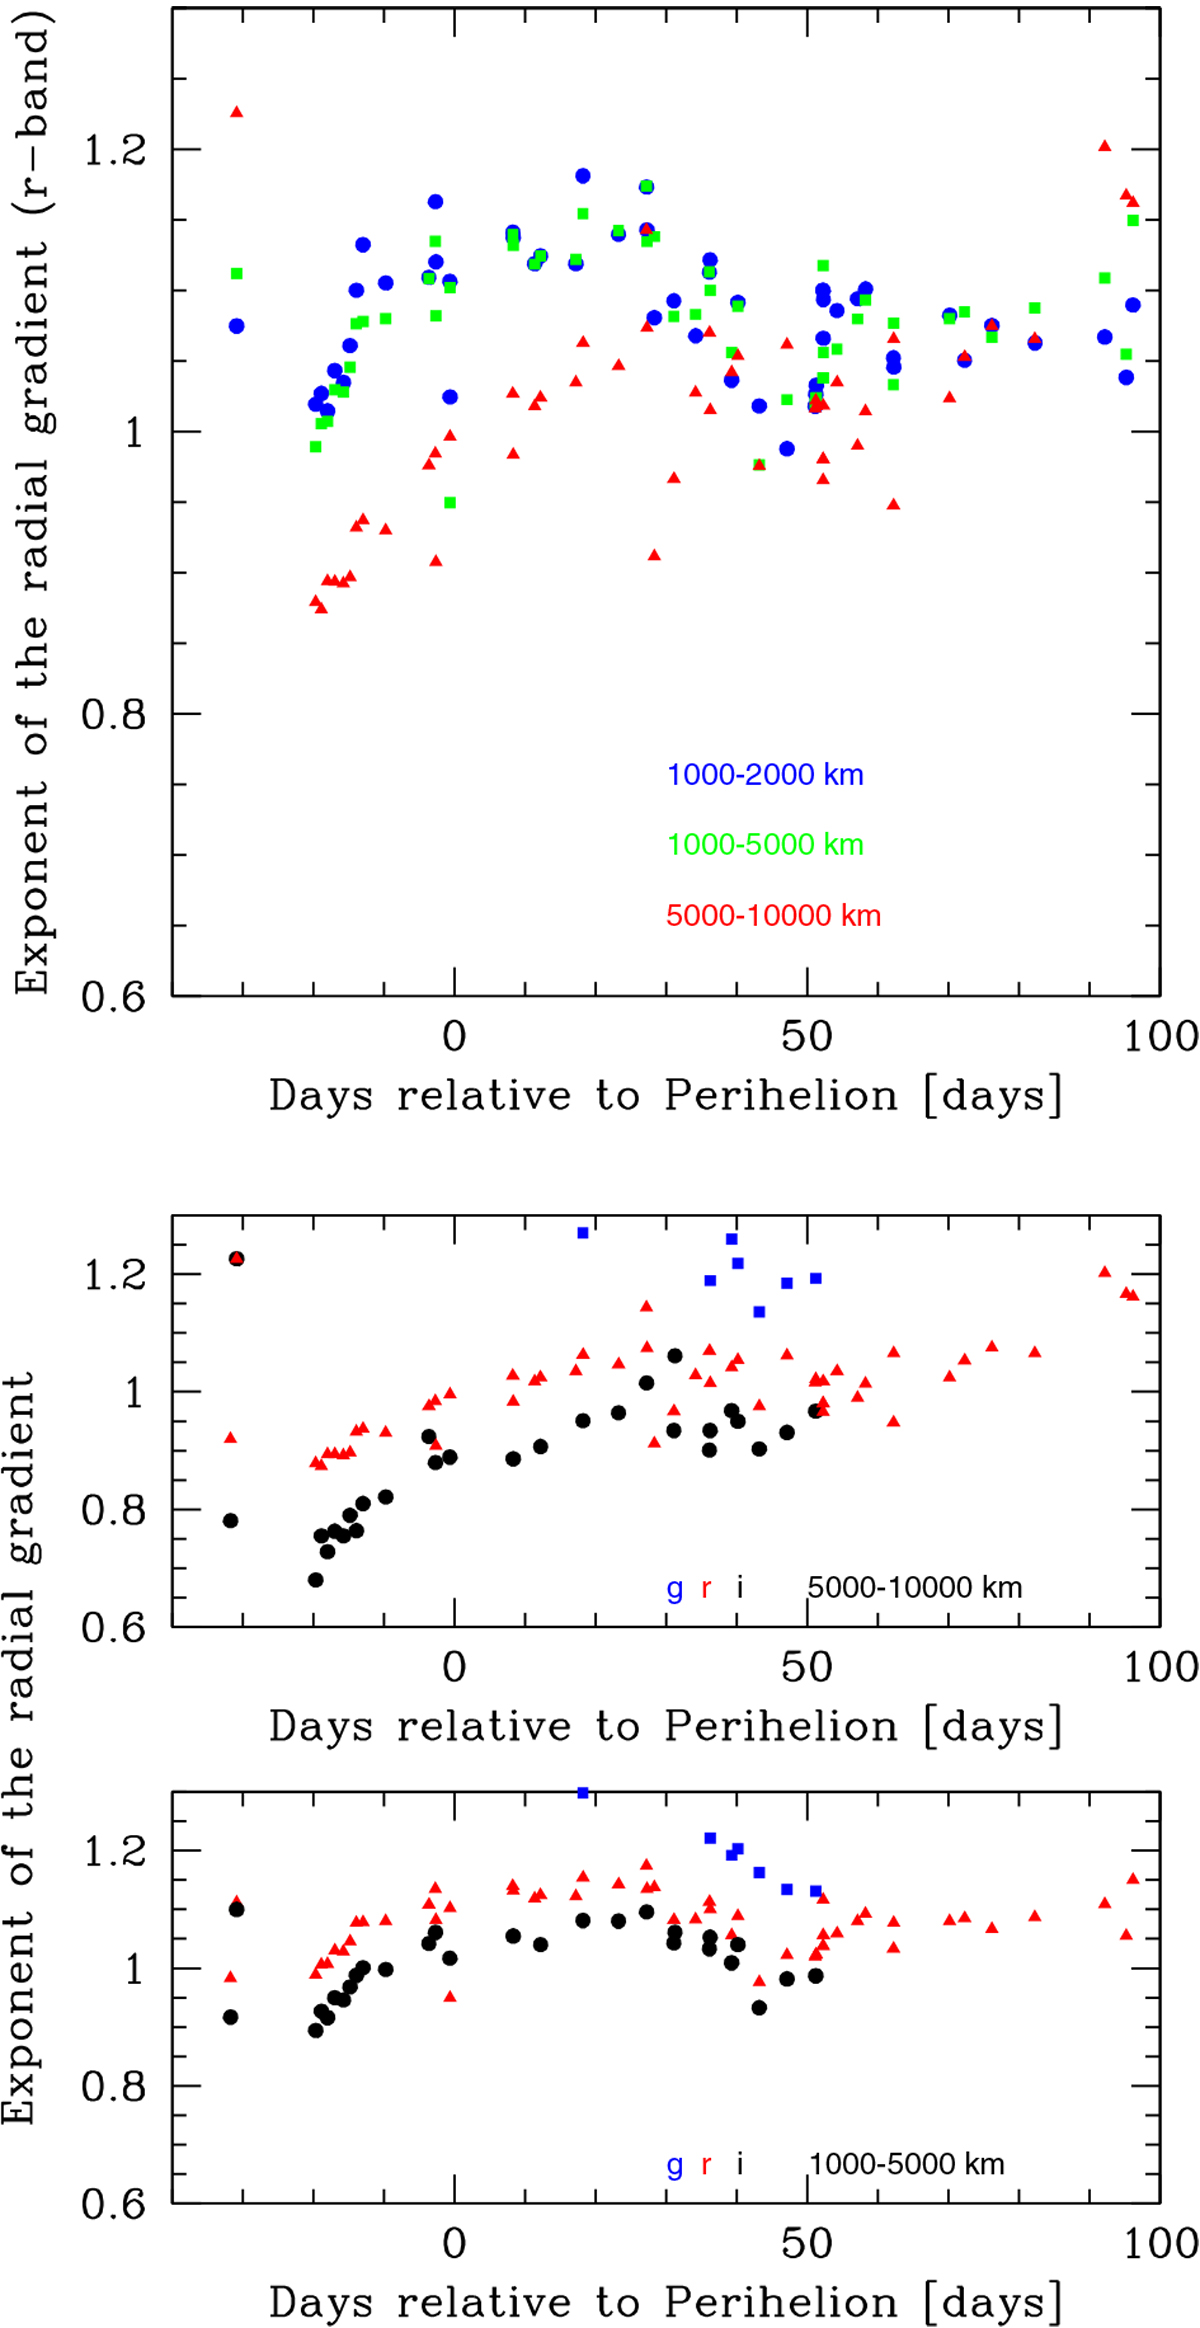
Exponents of the radial coma profile in comet 41P vs. time. Top panel: SDSS r filter – the exponents are determined for various distance ranges in the coma, i.e., in the ranges 1000–2000 (blue), 1000–5000 (green), and 5000–10 000 km (red) from the coma center at the distance of the comet. Middle and bottom panels: temporal evolution of the radial coma exponent in SDSS g filter (blue squares), in SDSS r filter (red triangles), and in SDSS i filter (black circles), for 5000–10 000 km distance (middle panel) and for 1000–5000 km distance (bottom panel). The numerical error of the individual results for the exponents is ±0.03.
Current usage metrics show cumulative count of Article Views (full-text article views including HTML views, PDF and ePub downloads, according to the available data) and Abstracts Views on Vision4Press platform.
Data correspond to usage on the plateform after 2015. The current usage metrics is available 48-96 hours after online publication and is updated daily on week days.
Initial download of the metrics may take a while.