Fig. 2
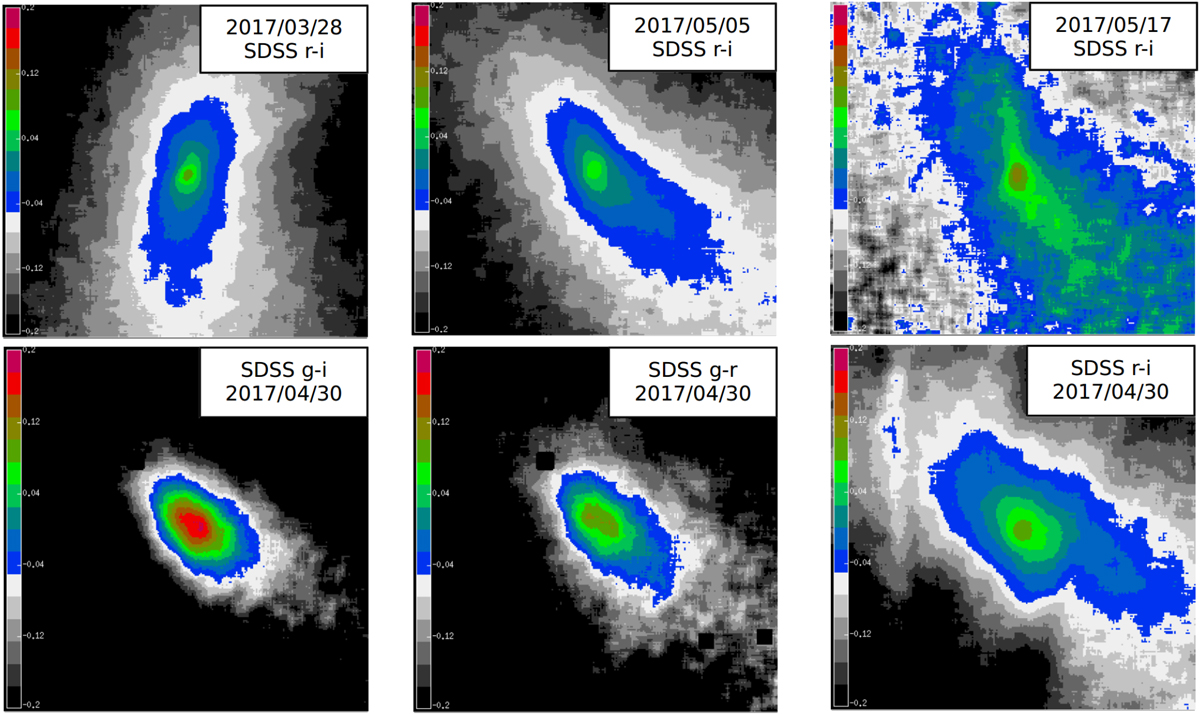
Color maps of the coma of 41P. Top row: color maps in SDSS r-i (field of view at the distance of the comet in parenthesis, date format in Year/month/day): left panel: on 2017 March 28 (5260 × 5260 km). Middle panel: on 2017 May 05 (7590 × 7590 km). Right panel: on 2017 May 17 (8450 × 8450 km). Bottom row: color maps on 2017 April 30 (field of view: 7080 × 7080 km at the comet): SDSS g-i (left panel), SDSS g-r (middle panel), SDSS r-i (right panel). The images are smoothed by a 5 × 5 pixels boxsize. The color bar on the left of the panels provides the color difference (in mag) compared to solar colors (range from −0.2 mag (black)to +0.2 mag (red)). North is up and east is to the left. Sun direction is opposite to the tail orientation in the southern coma hemisphere.
Current usage metrics show cumulative count of Article Views (full-text article views including HTML views, PDF and ePub downloads, according to the available data) and Abstracts Views on Vision4Press platform.
Data correspond to usage on the plateform after 2015. The current usage metrics is available 48-96 hours after online publication and is updated daily on week days.
Initial download of the metrics may take a while.