Fig. 10
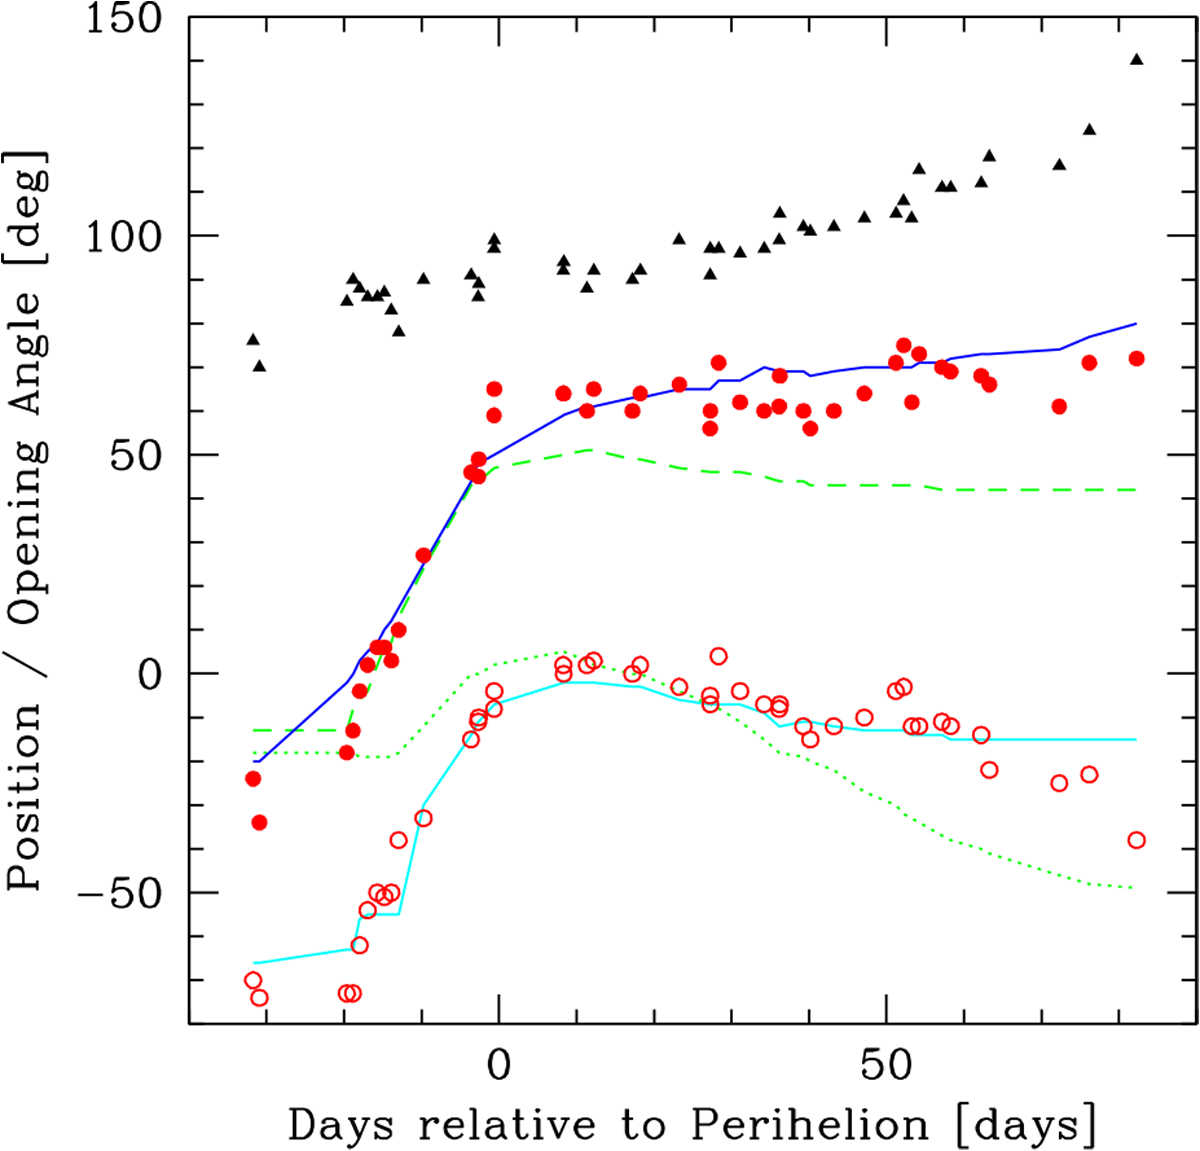
Position angles and opening angle of coma Fan A seen in comet 41P vs. time to or from perihelion. The plot shows the temporal evolution of the observed position angle for the western (‘Awest’ = red open circle) and eastern (‘Aeast’ = red filled circle) edge of Fan A (for ‘Awest’ and ‘Aeast’ see Table A.5). Lines show the PAs of the fan edges obtained from model simulations, i.e., our model: eastern edge (continuous blue line), western edge (continuous cyan line; model of Pozuelos et al. 2018), eastern edge (broken green line), and western edge (dotted green line). The observed PAs were measured at 2000 km projected nucleus distance at flux levels 5% above mean coma background at that distance. The opening angle results (black triangles) are derived from the PAs of the observed fan edges and are plotted withan offset of +30 deg for clarity.
Current usage metrics show cumulative count of Article Views (full-text article views including HTML views, PDF and ePub downloads, according to the available data) and Abstracts Views on Vision4Press platform.
Data correspond to usage on the plateform after 2015. The current usage metrics is available 48-96 hours after online publication and is updated daily on week days.
Initial download of the metrics may take a while.