Fig. 6.
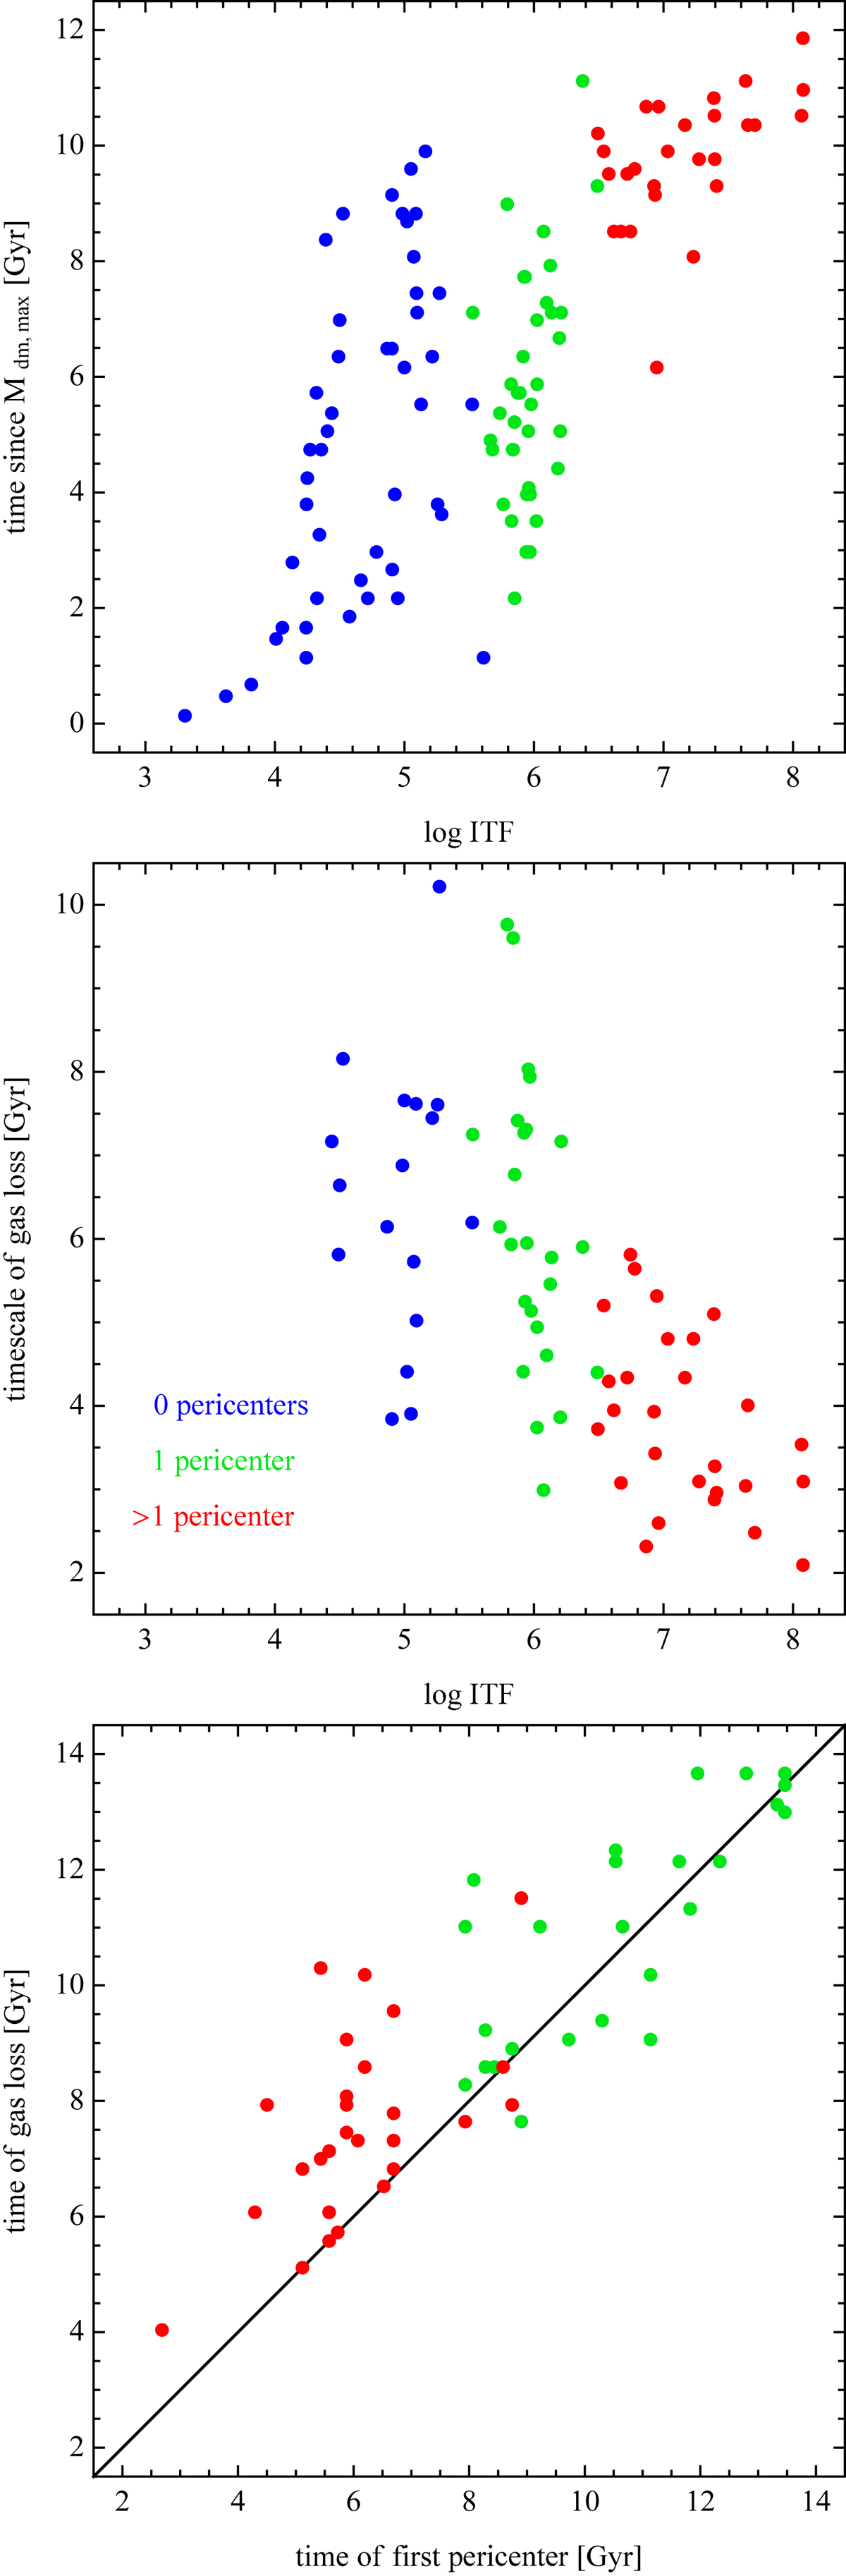
Timescales of galaxy evolution in the cluster. Upper panel: time since the maximum dark matter mass for all galaxies as a function of ITF. Middle panel: timescale of gas loss for the subsamples of galaxies that do not contain any gas at z = 0. Lower panel: time of gas loss as a function of the time of the first pericenter passage for the galaxies that had at least one pericenter and lost all the gas. The diagonal black line in the lower panel indicates the equality between these times. The color coding is the same as in Fig. 4.
Current usage metrics show cumulative count of Article Views (full-text article views including HTML views, PDF and ePub downloads, according to the available data) and Abstracts Views on Vision4Press platform.
Data correspond to usage on the plateform after 2015. The current usage metrics is available 48-96 hours after online publication and is updated daily on week days.
Initial download of the metrics may take a while.