Fig. 5.
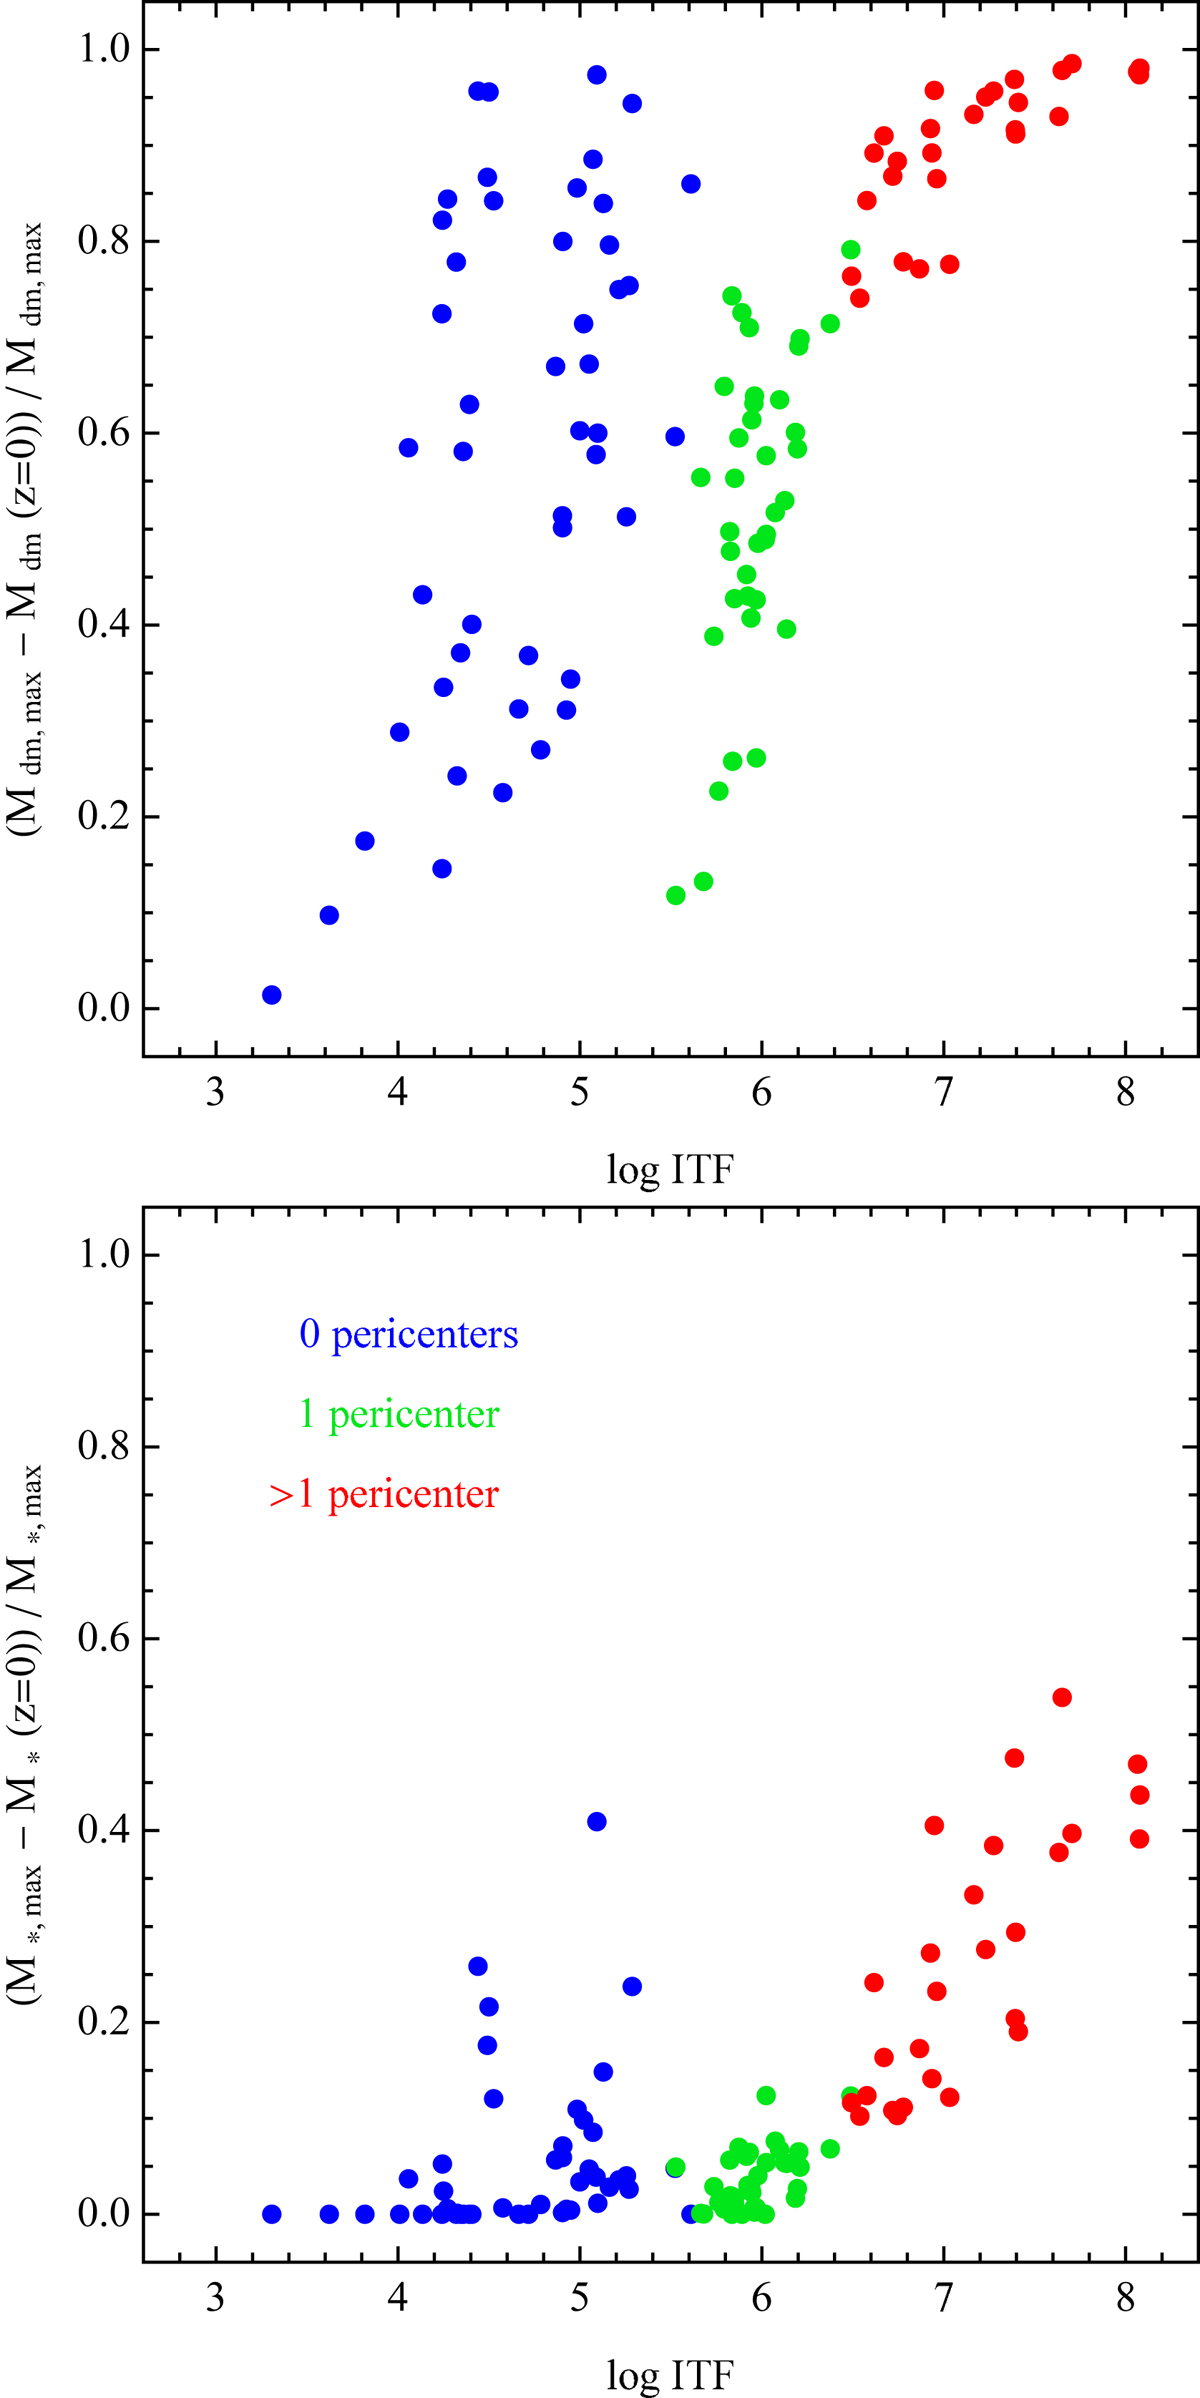
Mass loss in galaxies associated with the cluster. Upper panel: relative dark matter mass loss in terms of the difference between the maximum and the present dark mass with respect to the maximum mass, as a function of ITF. Lower panel: same quantity for the stellar mass of the galaxies. The color coding is the same as in Fig. 4.
Current usage metrics show cumulative count of Article Views (full-text article views including HTML views, PDF and ePub downloads, according to the available data) and Abstracts Views on Vision4Press platform.
Data correspond to usage on the plateform after 2015. The current usage metrics is available 48-96 hours after online publication and is updated daily on week days.
Initial download of the metrics may take a while.