Fig. 2.
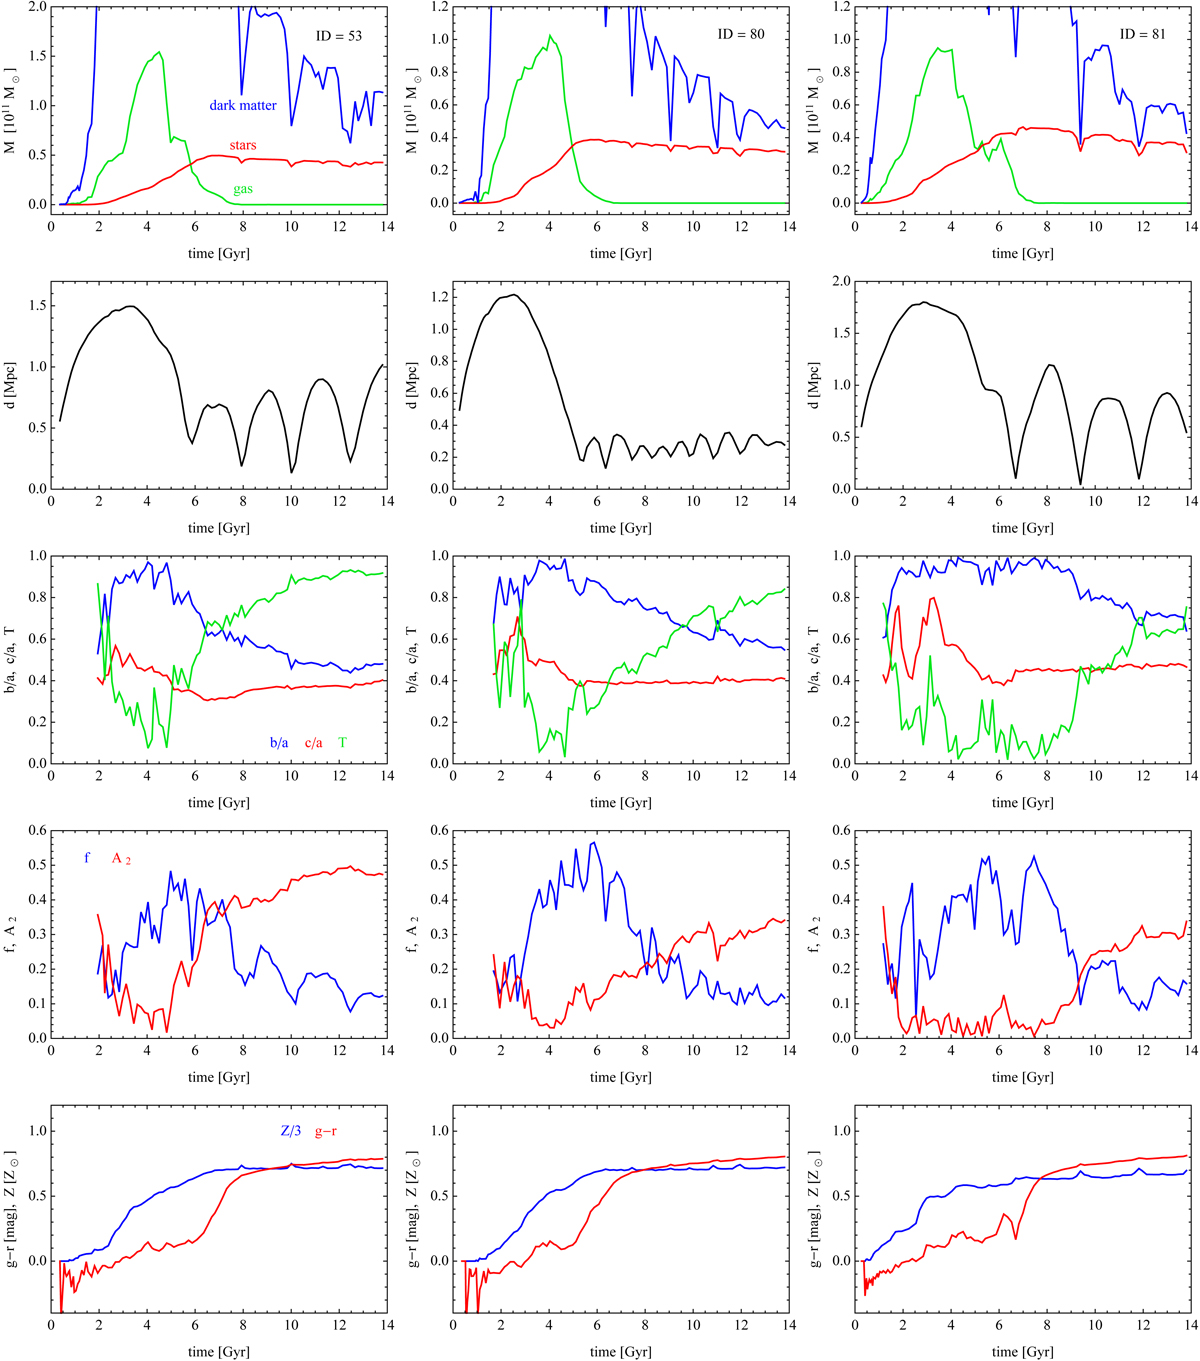
Evolution of galaxies in simulated cluster. Columns: results for different galaxies, with ID = 53, 80 and 81. Upper row: evolution of the dark, stellar and gas mass shown with the blue, red, and green lines, respectively. The data are the same as in Fig. 1, but the mass scale was adjusted to the range of stellar and gas masses. Second row: orbit of the galaxy within the cluster in terms of its distance from the cluster center in physical units. Third row: evolution of three structural properties of the galaxies, the axis ratios b/a (blue line) and c/a (red), and the triaxiality parameter T (green). Fourth row: rotation measure in terms of the fractional mass of stars on circular orbits f (blue) and the bar strength A2 (red). Fifth row: g − r color and metallicity Z (in solar units, divided by 3 to fit the same scale as the color).
Current usage metrics show cumulative count of Article Views (full-text article views including HTML views, PDF and ePub downloads, according to the available data) and Abstracts Views on Vision4Press platform.
Data correspond to usage on the plateform after 2015. The current usage metrics is available 48-96 hours after online publication and is updated daily on week days.
Initial download of the metrics may take a while.