Fig. 14.
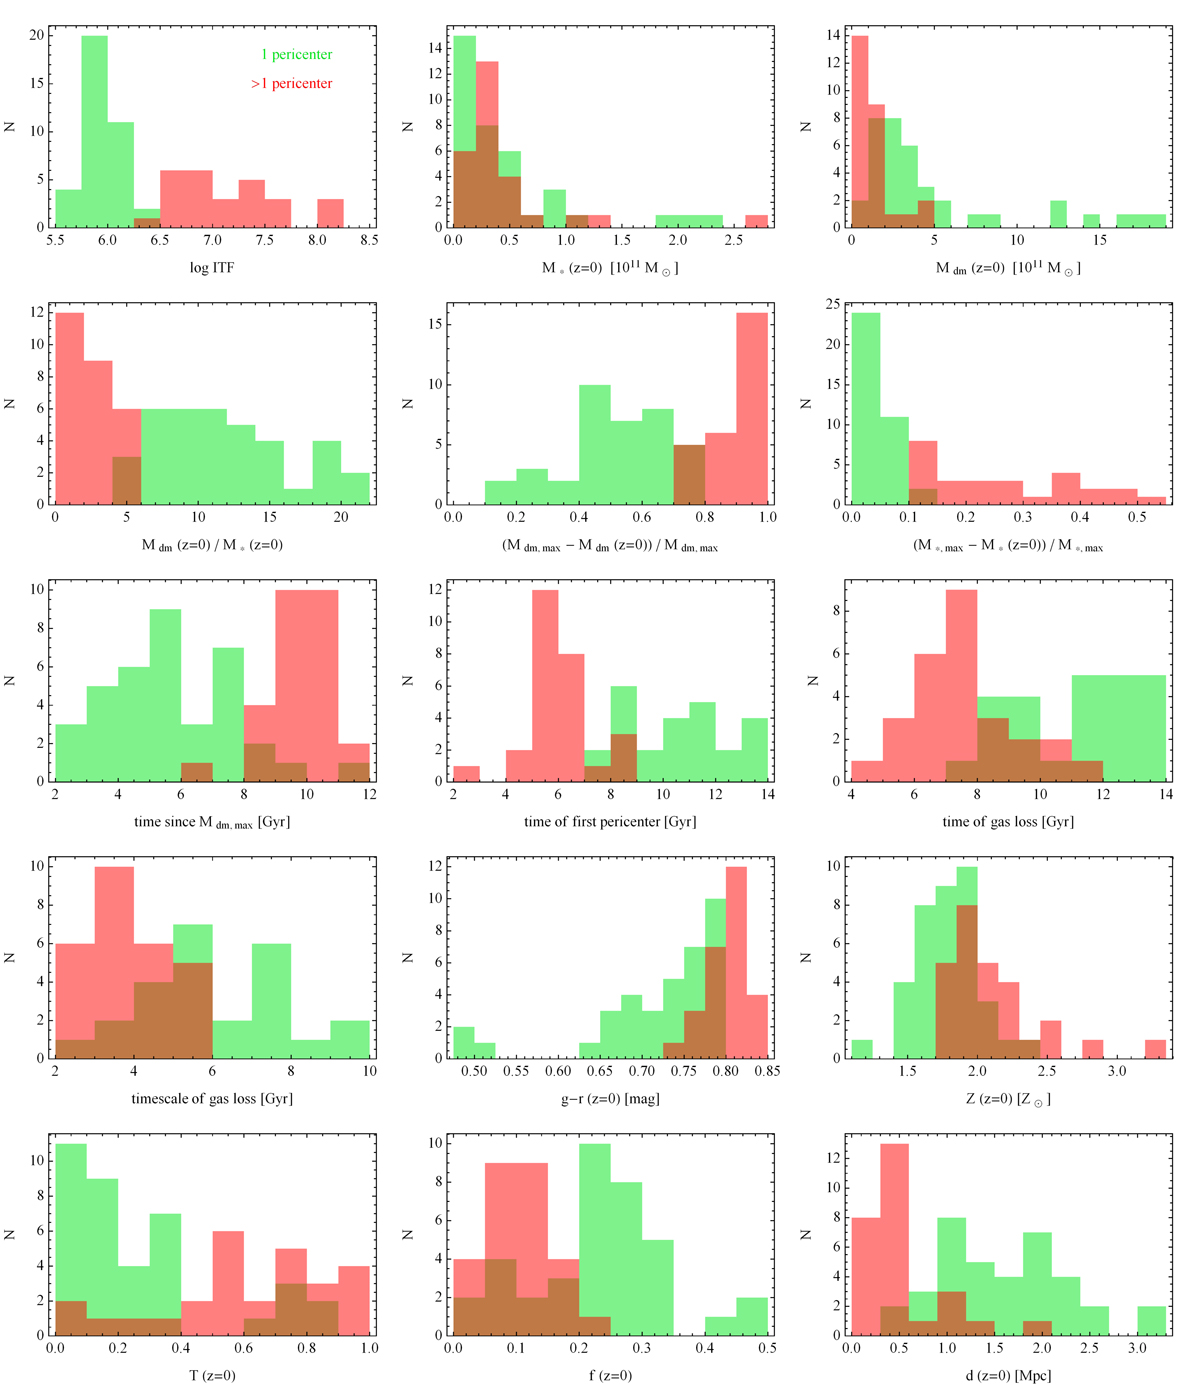
Histograms of distributions of different properties in the weakly evolved (one pericenter, green) and strongly evolved (more than one pericenter, red) sample of galaxies. The panels summarize the results shown in Figs. 4–7 and 9–10 by binning the data instead of plotting them as points, with N corresponding in each case to the number of galaxies in a given bin.
Current usage metrics show cumulative count of Article Views (full-text article views including HTML views, PDF and ePub downloads, according to the available data) and Abstracts Views on Vision4Press platform.
Data correspond to usage on the plateform after 2015. The current usage metrics is available 48-96 hours after online publication and is updated daily on week days.
Initial download of the metrics may take a while.