Free Access
Fig. 1.
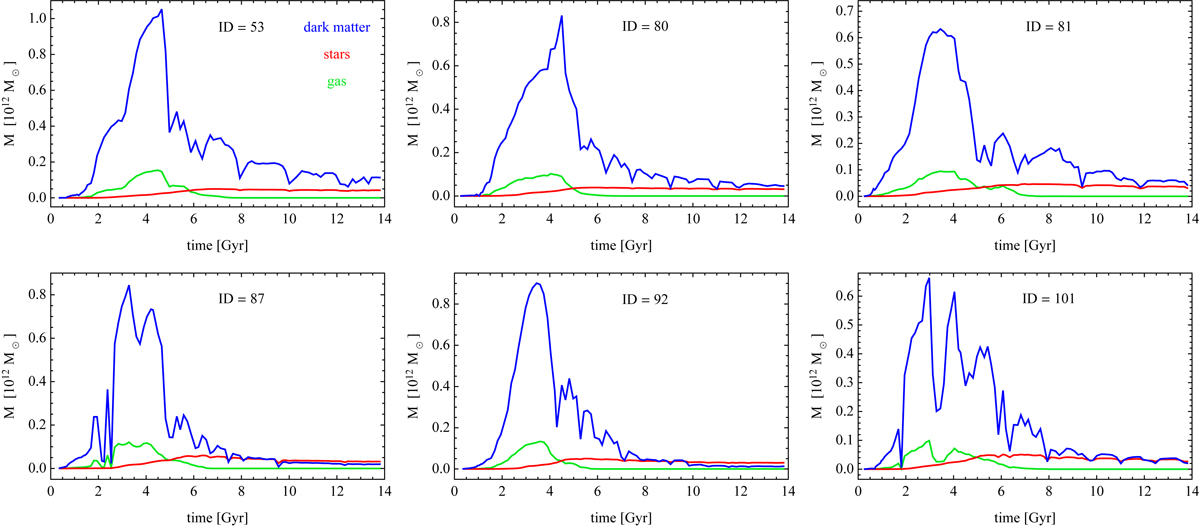
Evolution of masses of galaxies with ID = 53, 80, 81, 87, 92, and 101 in the simulated cluster. The mass of the dark, stellar, and gas component is shown with the blue, red, and green lines, respectively, with the mass scale adjusted to the range of dark matter masses.
Current usage metrics show cumulative count of Article Views (full-text article views including HTML views, PDF and ePub downloads, according to the available data) and Abstracts Views on Vision4Press platform.
Data correspond to usage on the plateform after 2015. The current usage metrics is available 48-96 hours after online publication and is updated daily on week days.
Initial download of the metrics may take a while.