Fig. 8
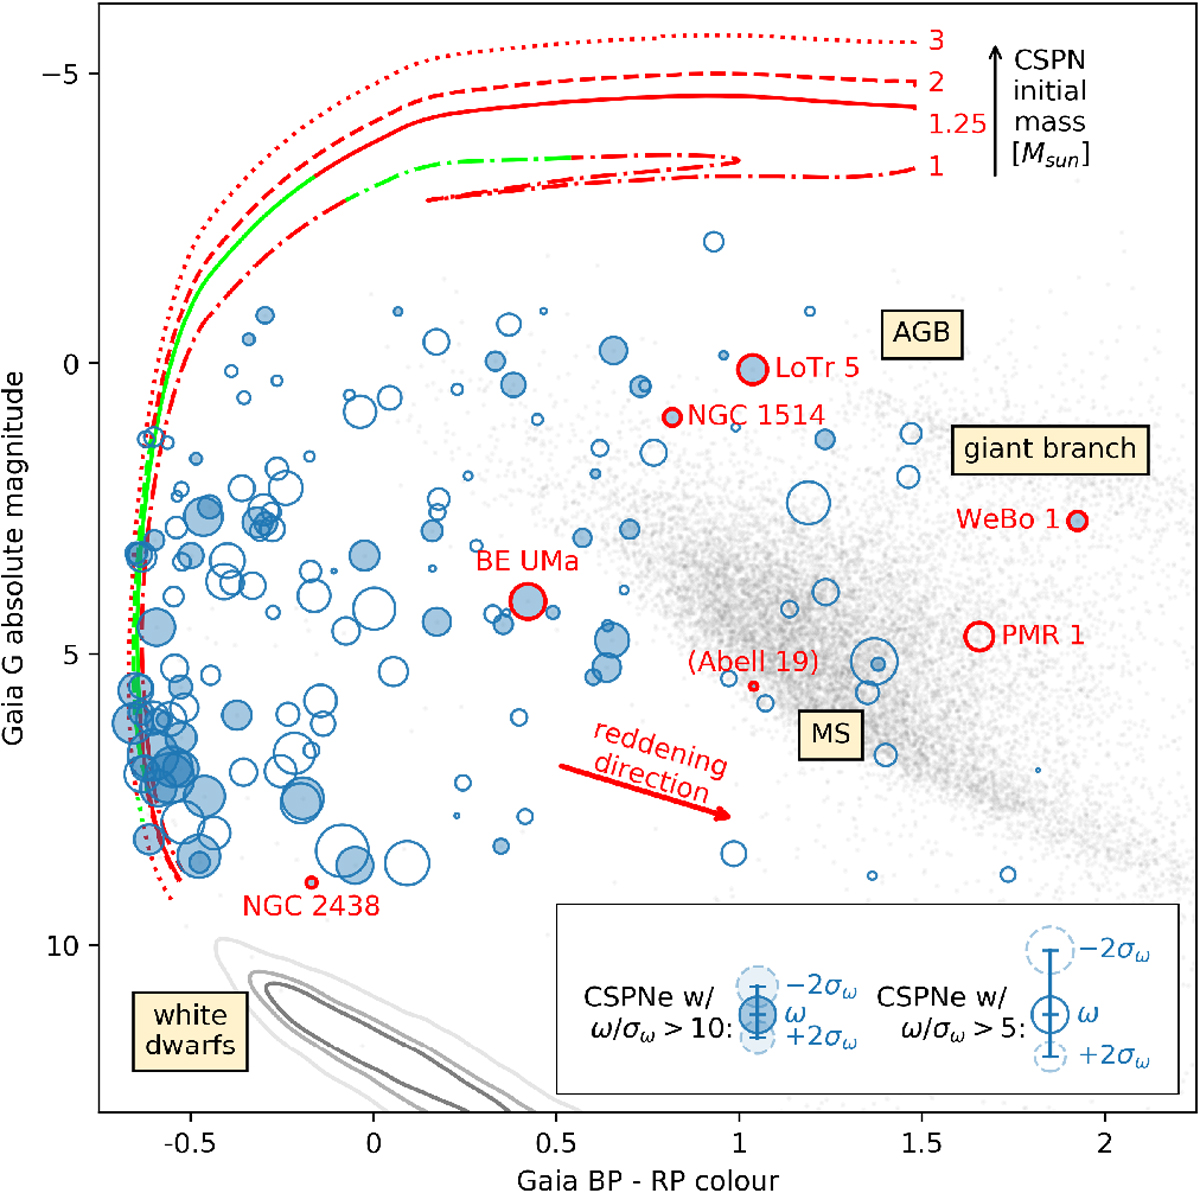
PN central stars plotted on an observational HR diagram, with the circular markers scaled according to the physical radii of the PNe as in Fig. 7. Filled circles indicate objects with the lowest uncertainties. Individual PNe referenced in the text are coloured red rather than blue and accompanied by the PN name. Red lines represent CSPN tracks from Miller Bertolami (2016) for solar metallicity and various initial masses, with the green portions of the line denoting time since leaving the AGB of between 1000 and 20 000 yr, indicative of the sorts of timescales during which a PN could be visible. The peak temperatures of these tracks, through which the stars evolve relatively quickly, are located at an absolute Gaia magnitude around 5 (see text for details). In the background, the grey points are the other sources that were loaded in the 60′′ search windows, with σω∕ω < 10%. They trace out the main sequence (MS) and giant branch. The beginning of the AGB is also labelled, with its position taken from Gaia Collaboration (2018a). White dwarfs are shown separately, as they are too rare to appear otherwise, with the grey contours in the lower left representing the 10, 30, and 50% density contours of the observed high confidence white dwarf candidates from Gentile Fusillo et al. (2019), where the same quality cuts have been made as for the background points.
Current usage metrics show cumulative count of Article Views (full-text article views including HTML views, PDF and ePub downloads, according to the available data) and Abstracts Views on Vision4Press platform.
Data correspond to usage on the plateform after 2015. The current usage metrics is available 48-96 hours after online publication and is updated daily on week days.
Initial download of the metrics may take a while.