Fig. 4

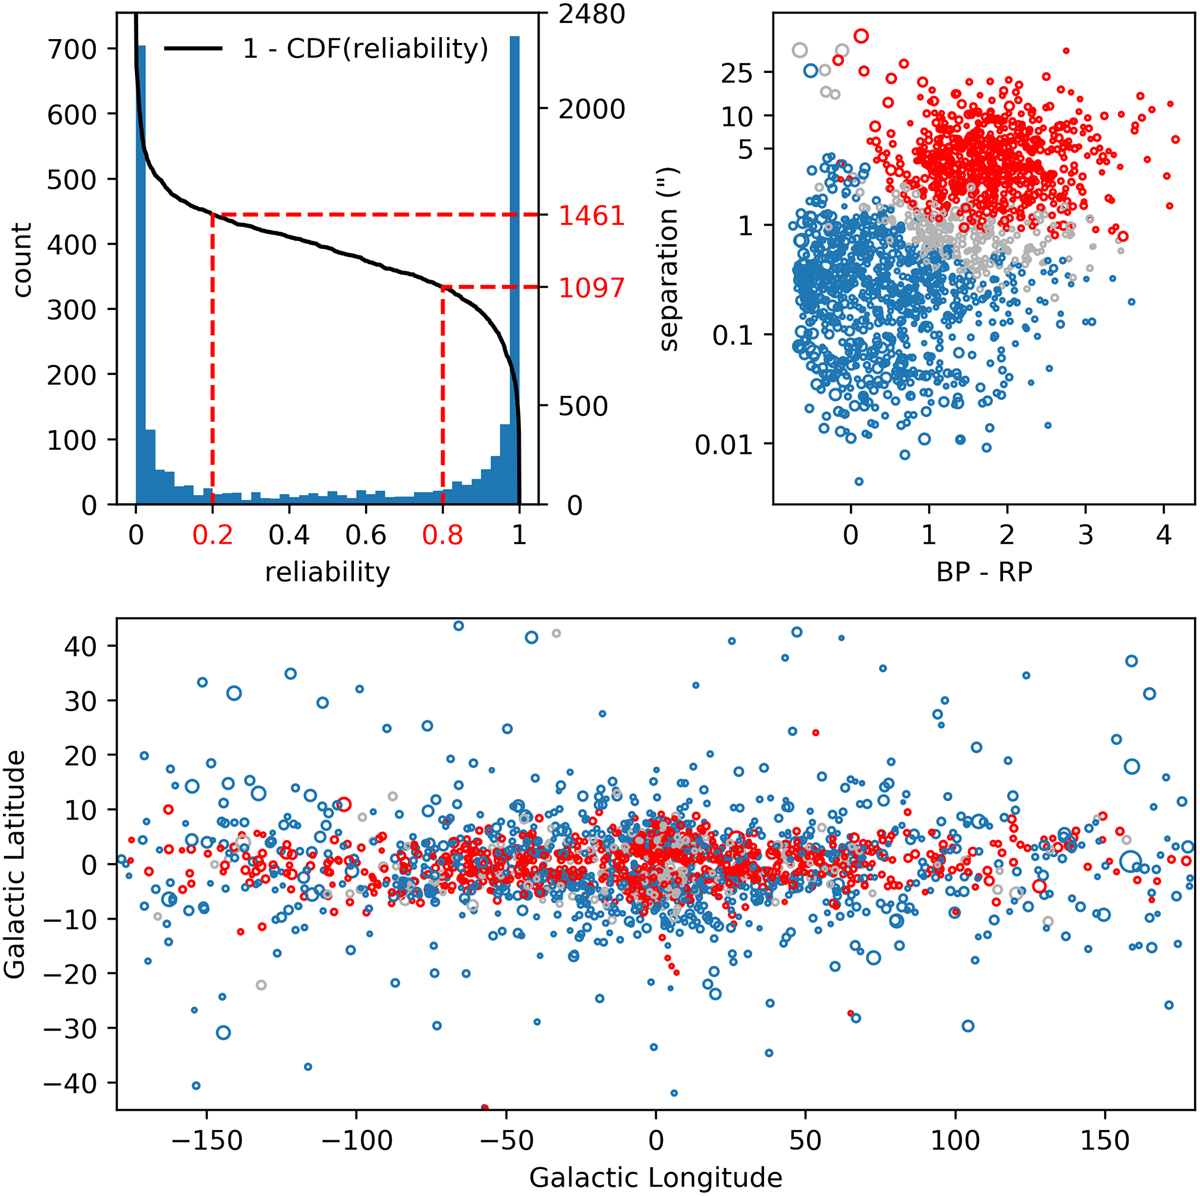
Matching results for confirmed PNe in HASH. The histogram on the upper left shows the reliabilities of highest ranked candidate central stars for each PN. Over-plotted is the mirrored cumulative distribution function (CDF) of that distribution, with the cutoffs and counts for best and potential matches highlighted. The two scatter plots show the distribution of the matches in colour/separation space and in galactic coordinates, with blue circles being likely matches, grey circles being possible matches, and red circles being rejected sources. Larger circles correspond to PN with larger angular sizes.
Current usage metrics show cumulative count of Article Views (full-text article views including HTML views, PDF and ePub downloads, according to the available data) and Abstracts Views on Vision4Press platform.
Data correspond to usage on the plateform after 2015. The current usage metrics is available 48-96 hours after online publication and is updated daily on week days.
Initial download of the metrics may take a while.


