Fig. 3
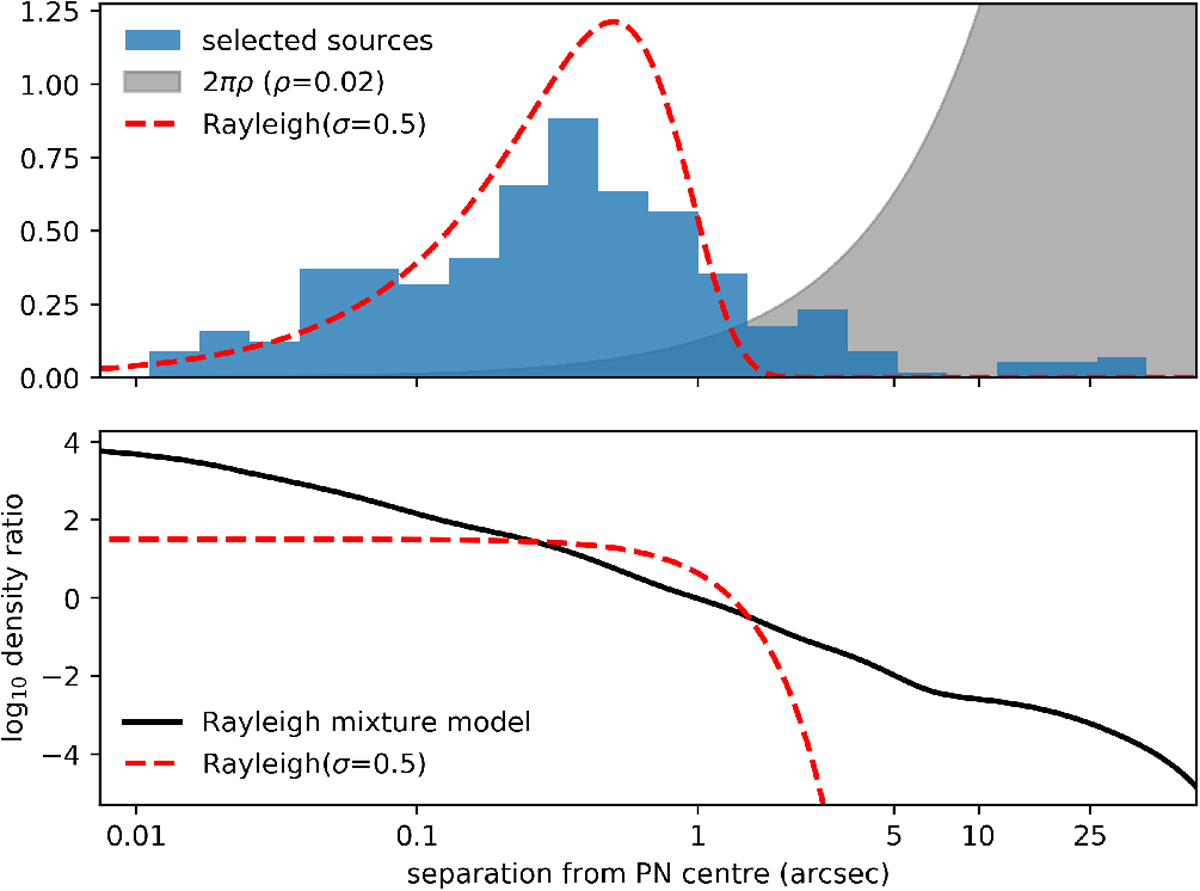
Histogram of the separations of the “high-confidence” sources (selected by colour) from their PN centres, along with, for comparison, a Rayleigh distribution with a similar mode in red, and a uniform density of background sources in grey. Lower panel: separation density ratio resulting from the derived mixture of Rayleigh distributions compared to that from the single Rayleigh distribution in the upper panel. In practice the mixture is re-weighted depending on the radius of the PN.
Current usage metrics show cumulative count of Article Views (full-text article views including HTML views, PDF and ePub downloads, according to the available data) and Abstracts Views on Vision4Press platform.
Data correspond to usage on the plateform after 2015. The current usage metrics is available 48-96 hours after online publication and is updated daily on week days.
Initial download of the metrics may take a while.