Fig. 11
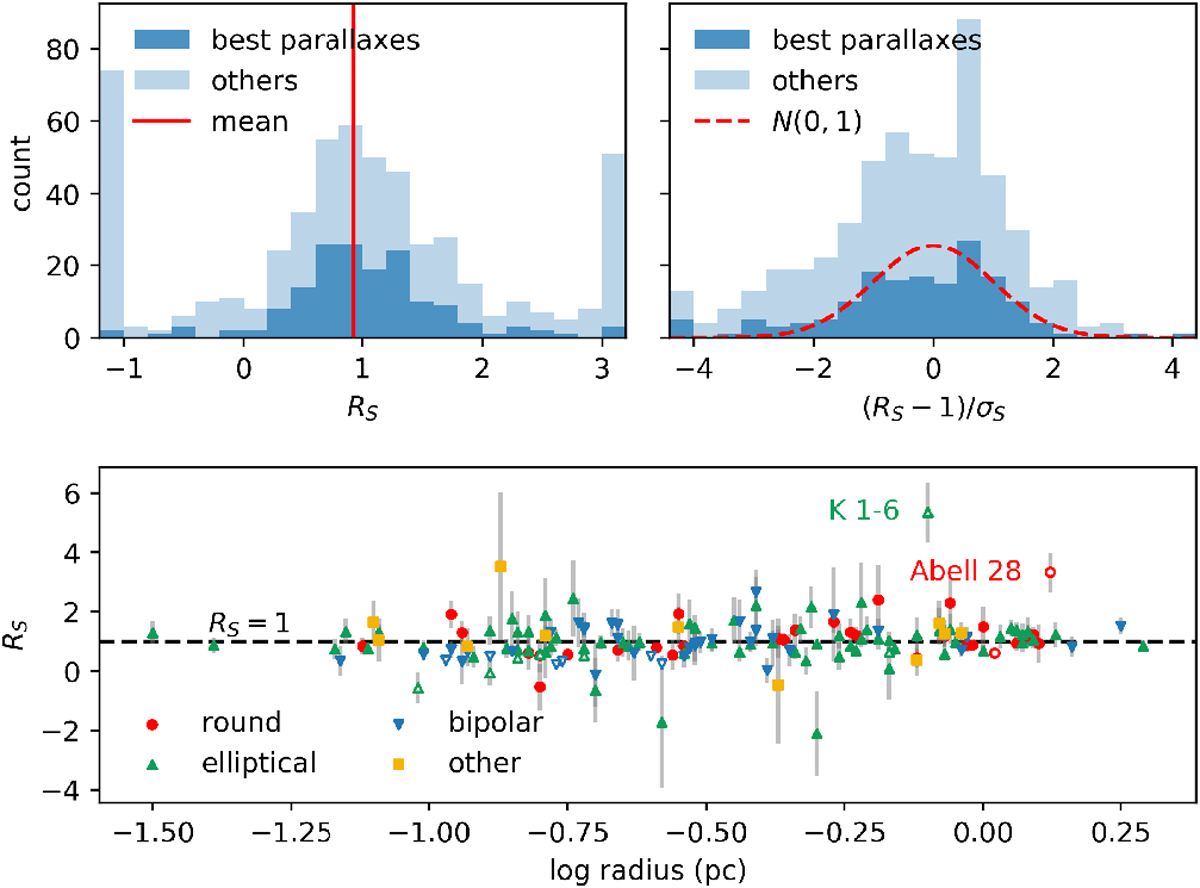
Histograms of distance ratios RS and normalised distance ratios RS∕σS derived from comparison between Gaia parallaxes and statistical distances (using subtrends) from FPB16. Ratios are plottedfor both the higher quality set of parallaxes (see text) and rejected parallaxes for comparison, in dark and light blue respectively. The plot on the left shows the raw distance ratios, with the mean value of 1.03 ± 0.06 for the best quality parallax set. On the right the distance ratios have been re-centred around RS = 1 and divided by their estimated uncertainties σR. Though the distribution of distance ratios is not expected to be Gaussian, a standard normal distribution is over-plotted for comparison. Below is a scatter plot depicting the distance ratios of the best parallax subset against the physical radius derived from the statistical distance. Marker colours and shapes show morphological classifications taken from HASH. Trends in this plot (that is, a correlation between distance ratio and radius) would be indicative of a slope differing from that derived in FPB16. Filled markers have RS within 2.5σS of 1 (dashedline). Outliers are empty markers, with the two outliers specifically mentioned in the text highlighted. The correlation coefficients are 0.18 and 0.08 with and without the outliers respectively. The former is very weakly significant, while the latter is not.
Current usage metrics show cumulative count of Article Views (full-text article views including HTML views, PDF and ePub downloads, according to the available data) and Abstracts Views on Vision4Press platform.
Data correspond to usage on the plateform after 2015. The current usage metrics is available 48-96 hours after online publication and is updated daily on week days.
Initial download of the metrics may take a while.