Fig. 5
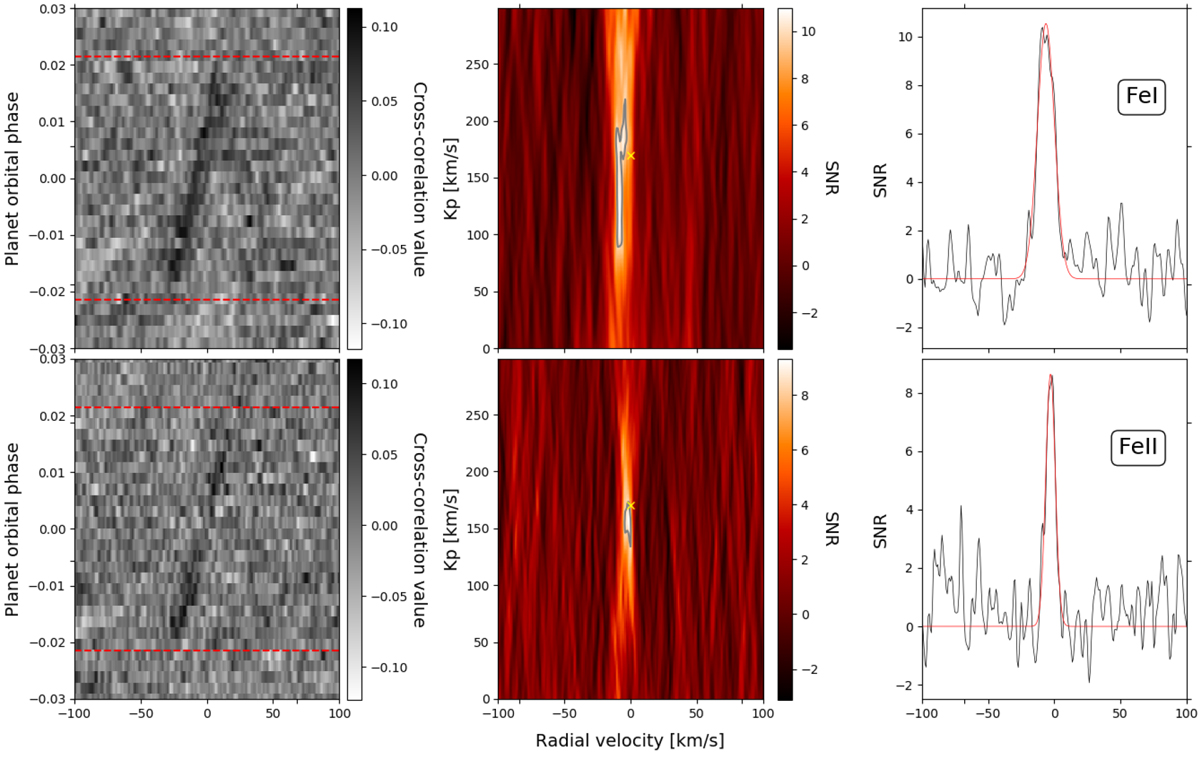
Cross-correlation residuals, Kp maps, and S/N plots after combining the three nights for each species. Left column: cross-correlation residual maps for Fe I and Fe II. Middle column: Kp map after cross-correlating residuals with the model of Fe I and Fe II. The yellow x is located at the predicted Kp value and 0 km s−1. The grey contour represents the area with 1σ from maximum signal. Right column: CCF values (black) for the predicted Kp value with the fitted Gaussian profile (red).
Current usage metrics show cumulative count of Article Views (full-text article views including HTML views, PDF and ePub downloads, according to the available data) and Abstracts Views on Vision4Press platform.
Data correspond to usage on the plateform after 2015. The current usage metrics is available 48-96 hours after online publication and is updated daily on week days.
Initial download of the metrics may take a while.