Fig. 3
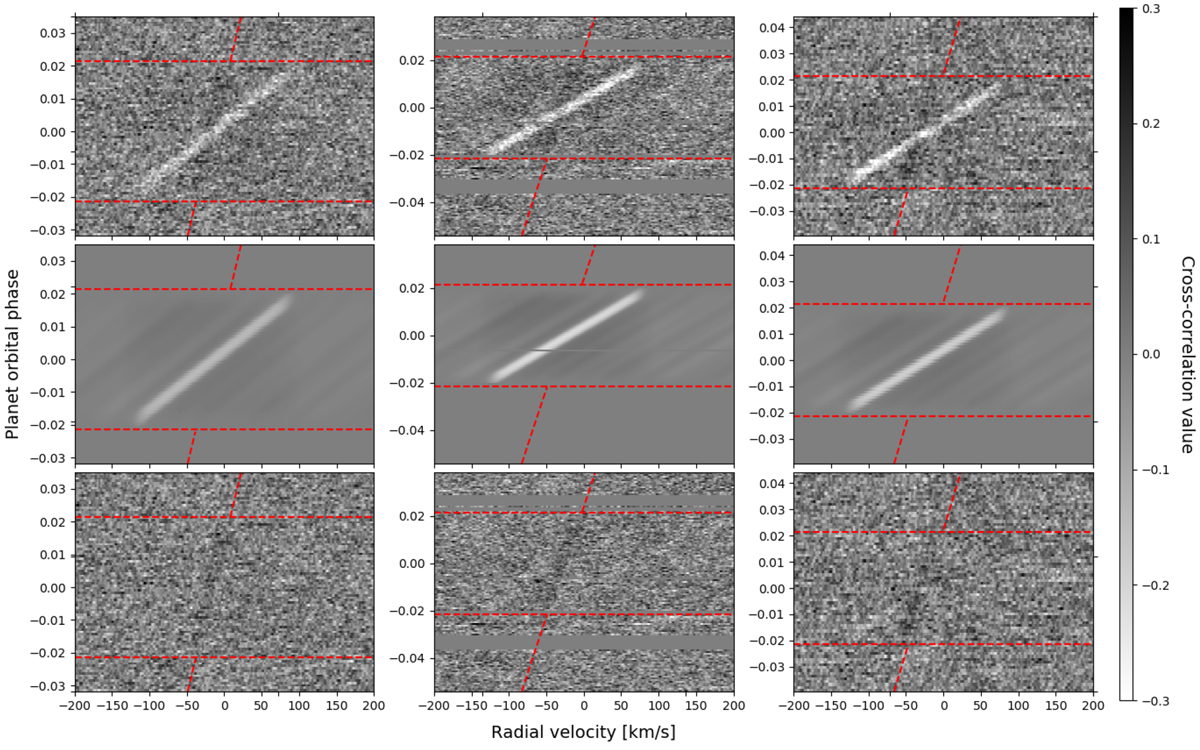
Cross-correlation residuals map of Fe I for each night. Top three panels: cross-correlation residuals for each night. Middle three panels: models of RME + CLV. Three bottom panels: cross-correlation residuals after removing the effects. The horizontal red dashed line shows first and last contacts of the transit; the tilted red dashed lines show the expected planet velocities.
Current usage metrics show cumulative count of Article Views (full-text article views including HTML views, PDF and ePub downloads, according to the available data) and Abstracts Views on Vision4Press platform.
Data correspond to usage on the plateform after 2015. The current usage metrics is available 48-96 hours after online publication and is updated daily on week days.
Initial download of the metrics may take a while.