Fig. 5.
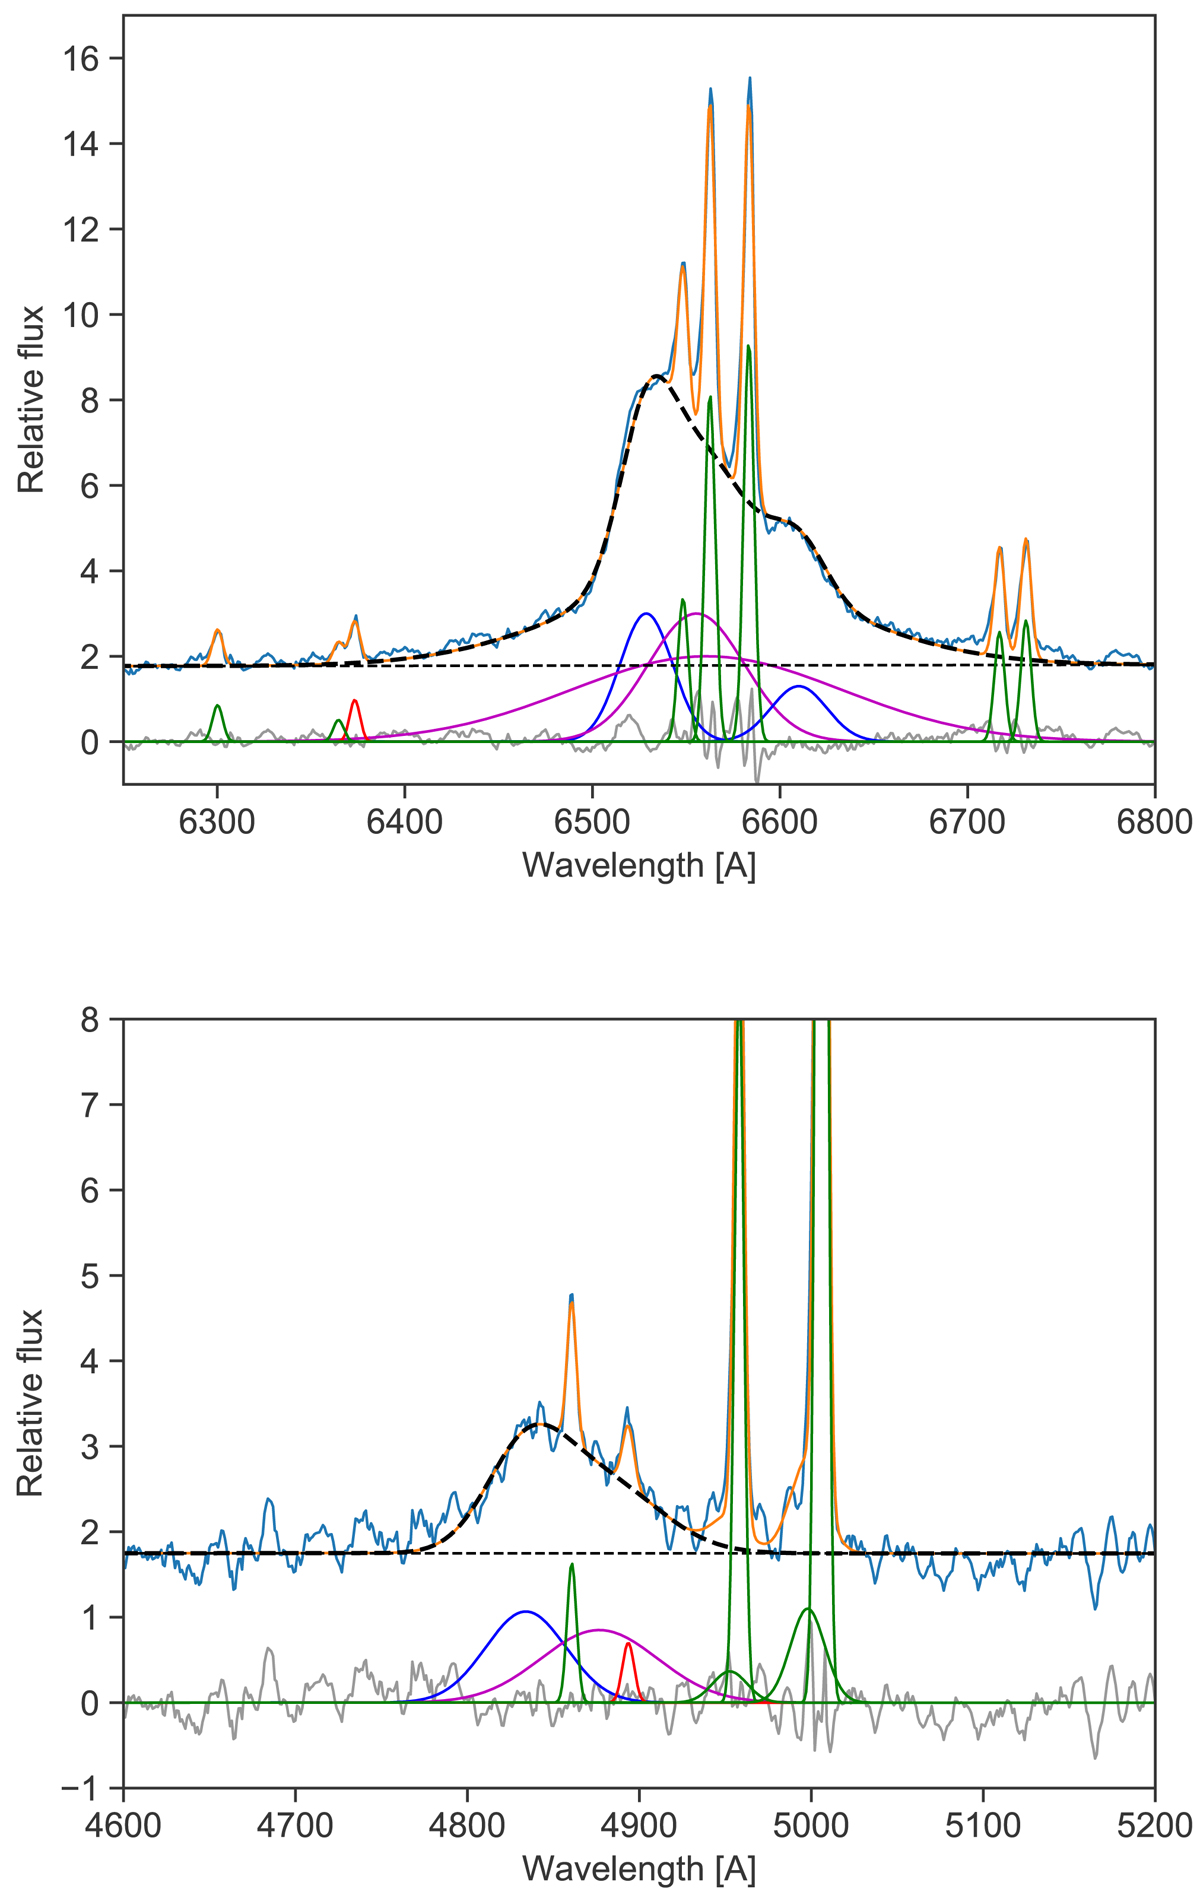
Multicomponent fitting of the Hα (top) and Hβ (bottom) lines. Below the observed (blue) and modeled (orange) spectrum, the residual (gray) and all Gaussian components are shown (blue, magenta – broad components of Hα (up) and Hβ; green – narrow lines; red – forbidden [Fe X] λ6374 and [Fe VII] λ4893 lines). The thick dashed line indicates the modeled broad line; this is the sum of all broad Gaussian components.
Current usage metrics show cumulative count of Article Views (full-text article views including HTML views, PDF and ePub downloads, according to the available data) and Abstracts Views on Vision4Press platform.
Data correspond to usage on the plateform after 2015. The current usage metrics is available 48-96 hours after online publication and is updated daily on week days.
Initial download of the metrics may take a while.