Fig. 4
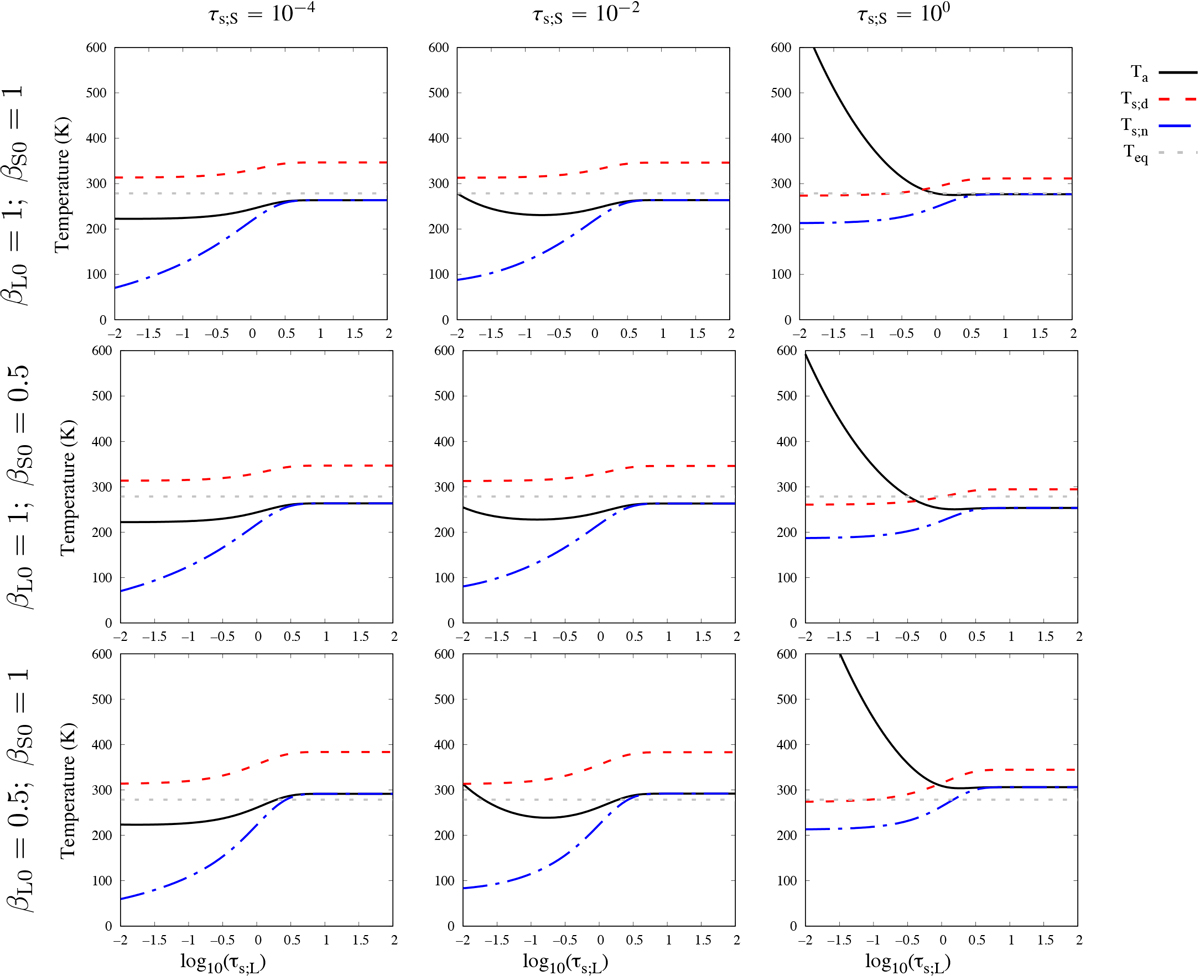
Atmospheric, dayside and nightside surface temperatures in pure radiative regime. Temperatures are plotted as functions of the logarithm of τs;L in the case of pure absorption (top panels), scattering in the shortwave (middle panels) and scattering in the longwave (bottom panels). Left: quasi-transparence in the shortwave (τs;S =10−4). Middle: small shortwave opacity (τs;S = 10−2). Large shortwave opacity (τs;S = 100). The atmospheric temperature (solid black line), dayside surface temperature (dashed red line), nightside surface temperature (dashed blue line), and black-body equilibrium temperature (dotted grey line) are plotted using Eqs. (51)–(53) and (2), respectively. Parameters values: As = 0.2, and F⋆ = 1366 W m−2.
Current usage metrics show cumulative count of Article Views (full-text article views including HTML views, PDF and ePub downloads, according to the available data) and Abstracts Views on Vision4Press platform.
Data correspond to usage on the plateform after 2015. The current usage metrics is available 48-96 hours after online publication and is updated daily on week days.
Initial download of the metrics may take a while.