Fig. 2
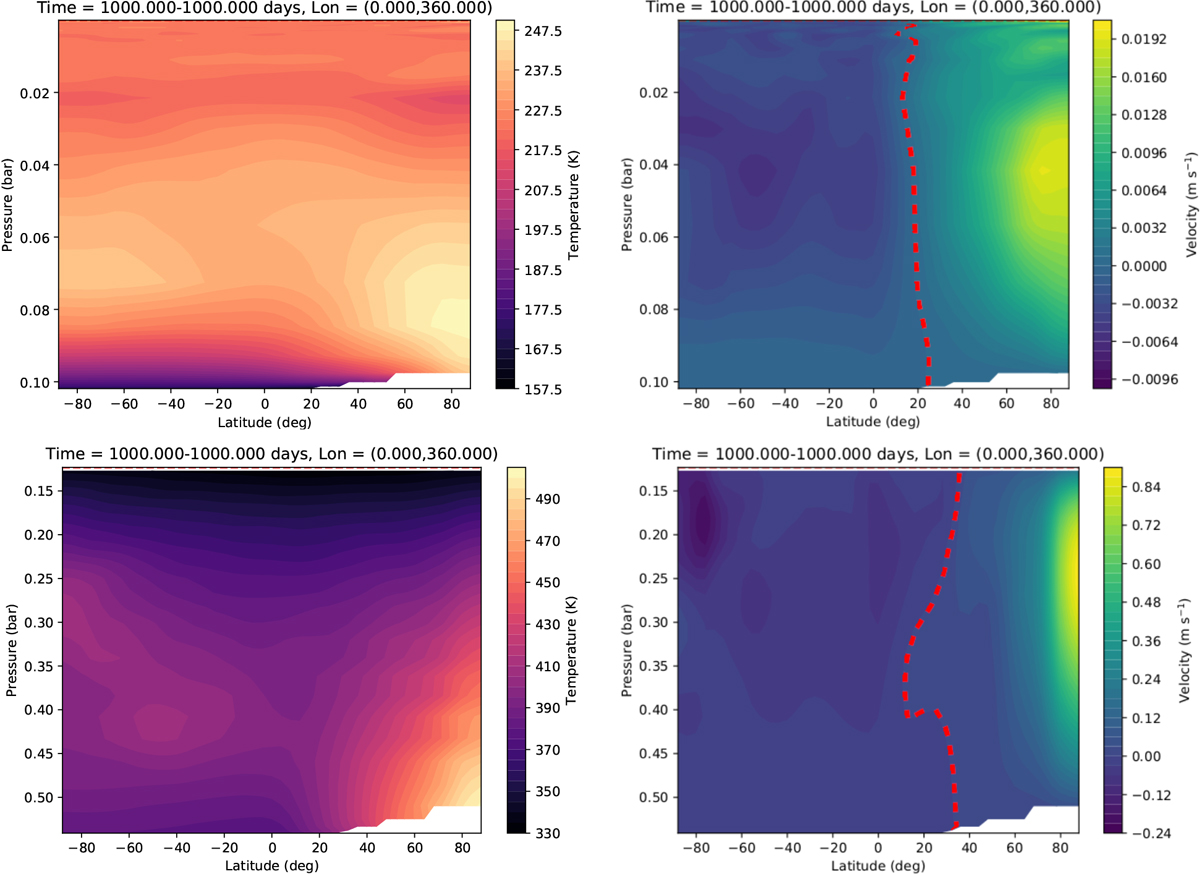
Instantaneous snapshots of zonally-averaged temperature (left panels) and vertical wind speed distributions (right panels) as functions of latitude and pressure with north pole at substellar point. Top: 0.1-bar CO2 -dominated atmosphere at Teq = 279 K (Wordsworth 2015, Fig. 2). Bottom: 0.5 bar N2-dominated atmosphere at Teq = 400 K (Koll & Abbot 2016, Fig. 4). Latitude is given in degrees (horizontal axis). This coordinate does not correspond to the usual latitude but to a latitude coordinate in the system of spherical coordinates where the north pole is the substellar point and the south pole the anti-stellar point. The associated colatitude is the stellar zenithal angle in this system of coordinates. Pressure is given in bars (vertical axis), temperature in K, and vertical velocity in m s−1. The white area at the substellar point indicates the region where surface pressure is lower than the spherically averaged surface pressure due to the updraft. The dotted red line indicates the transition between rising and subsiding flows, where the vertical velocity is zero.
Current usage metrics show cumulative count of Article Views (full-text article views including HTML views, PDF and ePub downloads, according to the available data) and Abstracts Views on Vision4Press platform.
Data correspond to usage on the plateform after 2015. The current usage metrics is available 48-96 hours after online publication and is updated daily on week days.
Initial download of the metrics may take a while.