Fig. 14
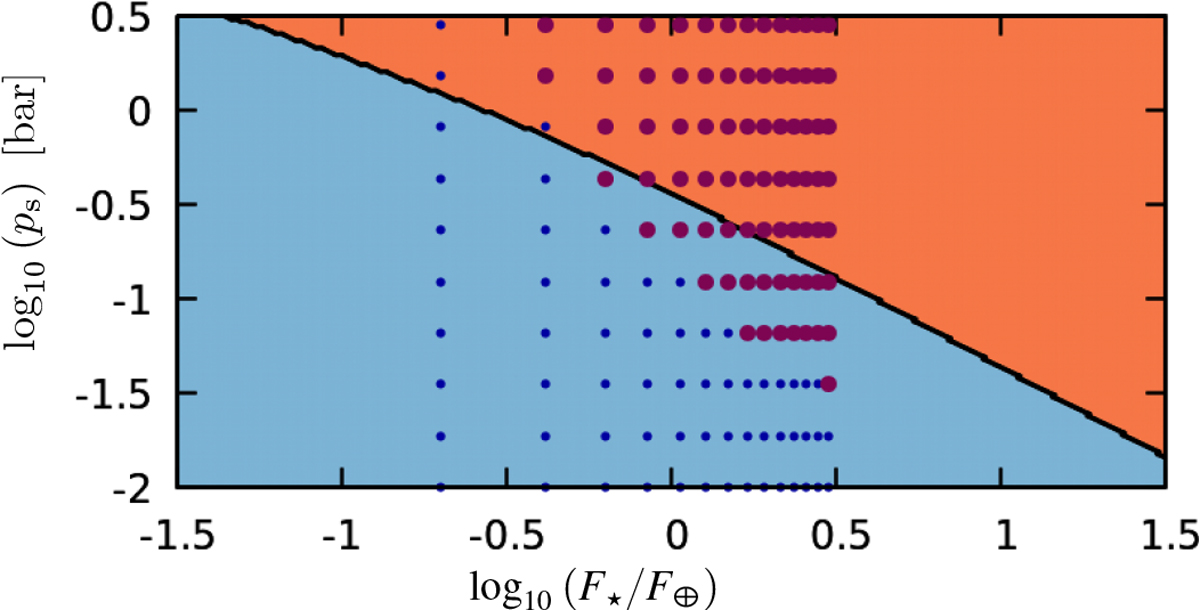
Stability diagram computed with one-dimensional radiative-convective-subsiding-upwelling (RCSU) model in reference case. The orange area indicate a stable atmosphere, and the blue area collapse in the RCSU model. Data computed by Wordsworth (2015) from GCM simulations (Fig. 12) are included for comparison. Violet dots indicate simulations where the atmosphere remained stable, while small blue dots indicate atmospheric collapse. Calculations are performed using parameters values given by Table 2 with n = 1, which corresponds to Fig. 2 (right panel) of Wordsworth (2015). Complementary parameters of the RCSU model are set to ![]() and Asub∕Aup = 10.
and Asub∕Aup = 10.
Current usage metrics show cumulative count of Article Views (full-text article views including HTML views, PDF and ePub downloads, according to the available data) and Abstracts Views on Vision4Press platform.
Data correspond to usage on the plateform after 2015. The current usage metrics is available 48-96 hours after online publication and is updated daily on week days.
Initial download of the metrics may take a while.