Fig. 13
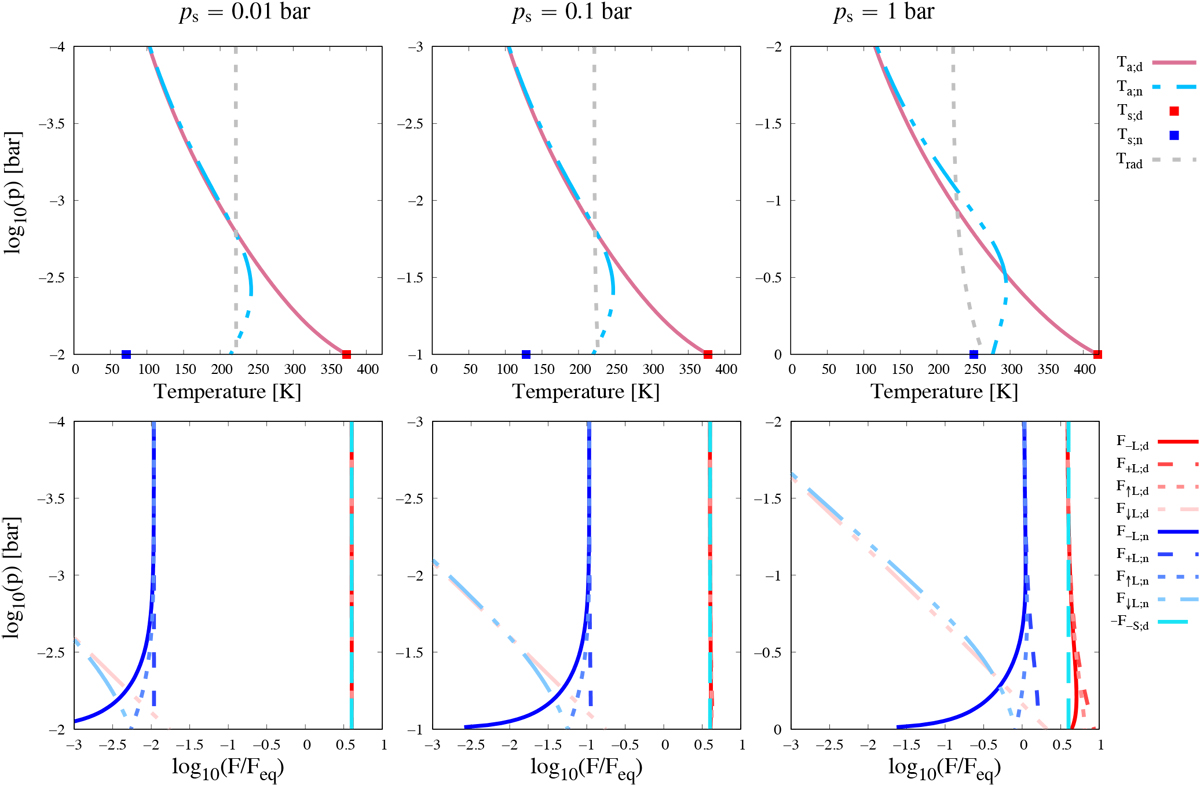
Temperature structure and fluxes profiles calculated with radiative-convective-subsiding-upwelling (RCSU) model in reference case for various surface pressures as functions of pressure levels in logarithmic scale. Left: ps = 0.01 bar and τs;L = 0.01. Middle: ps = 0.1 bar and τs;L = 0.1. Right: ps = 1 bar and τs;L = 1. Dayside atmospheric (solid pink line), nightside atmospheric (dashed sky blue line), dayside surface (red square), nightside surface (blue square), and radiative equilibrium (dotted grey line) temperatures (K) are plotted in top panels. Dayside (shades of red) and nightside (shades of blue) radiative net, total, upwelling, and downwelling fluxes in the longwave, and net flux in the shortwave (dashed cyan line) are plotted in bottom panels. Fluxes are normalised by the black body equilibrium flux
![]() , where Teq
is the black body equilibrium temperature defined by Eq. (2). Calculations are performed using parameters values given by Table 2 with
n = 1, which corresponds to Fig. 2 (right panel) of Wordsworth (2015). Complementary parameters of the RCSU model are set to
, where Teq
is the black body equilibrium temperature defined by Eq. (2). Calculations are performed using parameters values given by Table 2 with
n = 1, which corresponds to Fig. 2 (right panel) of Wordsworth (2015). Complementary parameters of the RCSU model are set to ![]() and Asub∕Aup = 10.
and Asub∕Aup = 10.
Current usage metrics show cumulative count of Article Views (full-text article views including HTML views, PDF and ePub downloads, according to the available data) and Abstracts Views on Vision4Press platform.
Data correspond to usage on the plateform after 2015. The current usage metrics is available 48-96 hours after online publication and is updated daily on week days.
Initial download of the metrics may take a while.