Fig. 12
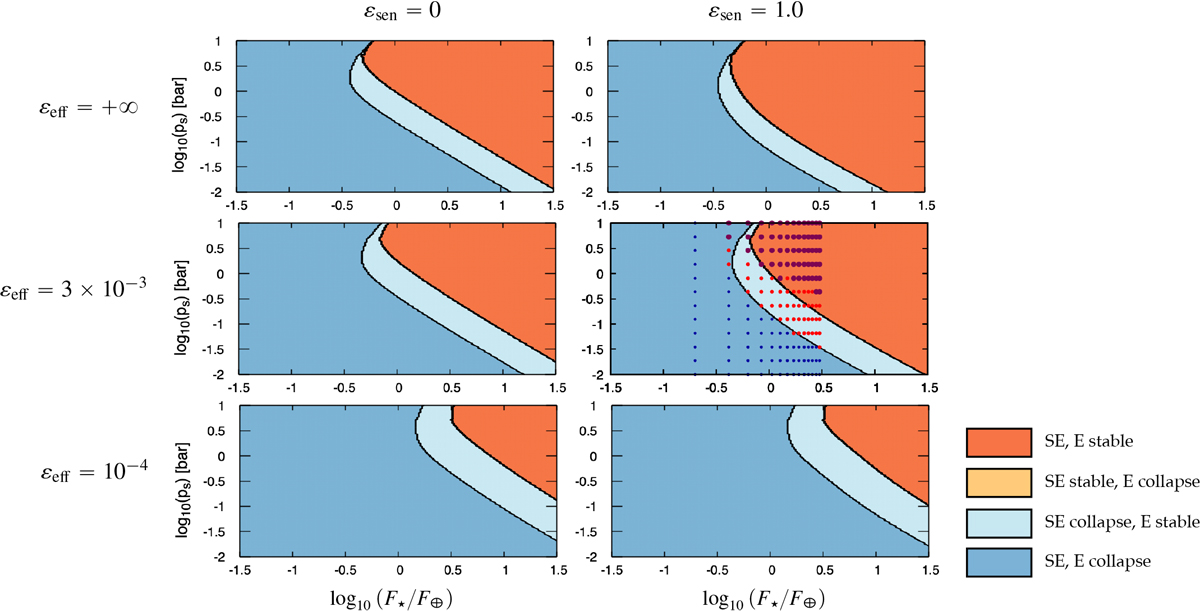
Comparative stability diagrams for 1 M⊕ and 10 M⊕ planets as functions of logarithms of stellar flux (horizontal axis) and surface pressure (vertical axis). The efficiency parameter controlling advective heat transport
εeff take the values ![]() (from bottom to top). Left column: case without sensible heating (εsen = 0). Right column: case with efficient sensible heating (εsen = 1.0). The stellar flux is normalised by the modern Earth’s value F⊕ = 1366 W m−2, and the surface pressure is given in bar. The acronyms “E” and “SE” are employed for “Earth” and “Super-Earth”, and designate the 1 M⊕ and 10 M⊕ planets, respectively. Colours indicate the stability of the steady state obtained in the two cases, similarly as in Fig. 10. These plots are obtained by solving Eq. (65) (Ladv = +∞, top panels) and Eq. (78) (other panels) with κL = 8.5 × 10⁻⁵ m2 kg−1 and parameters values given by Table 2 for the Earth-sized planet. In the case of the 10 M⊕ planet, the planet’s radius and mass are set to Mp = 10 M⊕ and Rp= 1.88 R⊕, respectively. Data computed by Wordsworth (2015) from GCM simulations (Fig. 12) are included in the middle right panel for comparison and indicate the region of atmospheric stability for the 1 M⊕ planet (red dots) and both planets (violet dots), and the region of atmospheric collapse (small blue dots).
(from bottom to top). Left column: case without sensible heating (εsen = 0). Right column: case with efficient sensible heating (εsen = 1.0). The stellar flux is normalised by the modern Earth’s value F⊕ = 1366 W m−2, and the surface pressure is given in bar. The acronyms “E” and “SE” are employed for “Earth” and “Super-Earth”, and designate the 1 M⊕ and 10 M⊕ planets, respectively. Colours indicate the stability of the steady state obtained in the two cases, similarly as in Fig. 10. These plots are obtained by solving Eq. (65) (Ladv = +∞, top panels) and Eq. (78) (other panels) with κL = 8.5 × 10⁻⁵ m2 kg−1 and parameters values given by Table 2 for the Earth-sized planet. In the case of the 10 M⊕ planet, the planet’s radius and mass are set to Mp = 10 M⊕ and Rp= 1.88 R⊕, respectively. Data computed by Wordsworth (2015) from GCM simulations (Fig. 12) are included in the middle right panel for comparison and indicate the region of atmospheric stability for the 1 M⊕ planet (red dots) and both planets (violet dots), and the region of atmospheric collapse (small blue dots).
Current usage metrics show cumulative count of Article Views (full-text article views including HTML views, PDF and ePub downloads, according to the available data) and Abstracts Views on Vision4Press platform.
Data correspond to usage on the plateform after 2015. The current usage metrics is available 48-96 hours after online publication and is updated daily on week days.
Initial download of the metrics may take a while.