Fig. 11
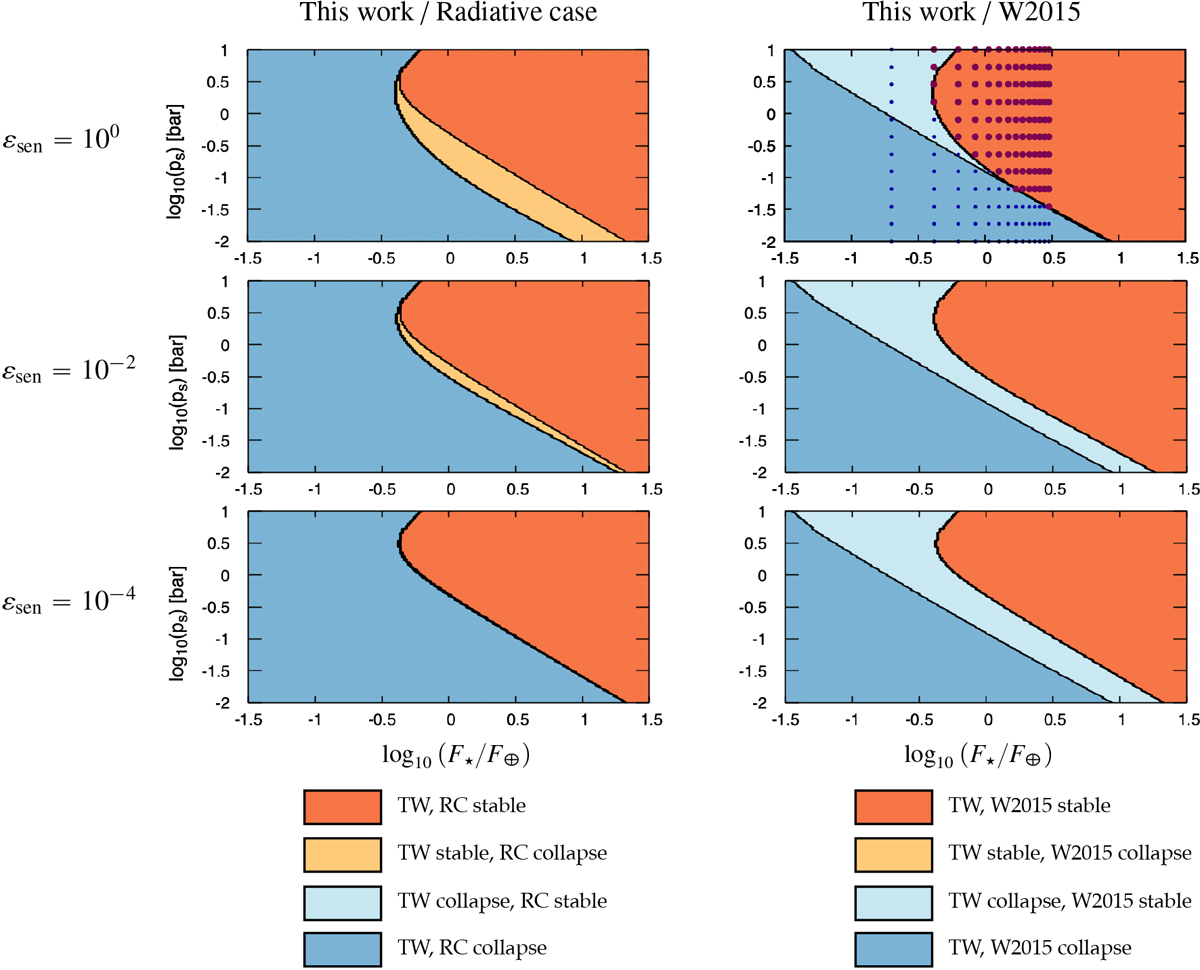
Comparative stability diagrams as functions of logarithms of stellar flux (horizontal axis) and surface pressure (vertical axis) for various intensities of sensible heating, εsen = 10−4, 10−2, 100 (from bottom to top). Left: comparison between the general case (Lsen > 0) and the purely radiative case characterised in Sect. 3.3 (Lsen = 0). Right: comparison between this work and the model developed by Wordsworth (2015) in thegeneral case. The stellar flux is normalised by the modern Earth’s value F⊕ = 1366 W m−2, and the surface pressure is given in bar. The acronyms “TW”, “RC”, and “W2015” are used for “This work” (with sensible heating), “Radiative case” (without sensible heating), and “Wordsworth (2015)”, respectively. Colours indicate the stability of the steady state predicted by the two models, similarly as in Fig. 10. These plots are obtained by solving Eq. (65) (Ladv = +∞) and Eq. (45) of Wordsworth (2015) with parameters values given by Table 2. Violet dots (top right panel) indicate the region of atmospheric stability computed by Wordsworth (2015) from GCM simulations (Fig. 12), while small blue dots indicate the region of collapse.
Current usage metrics show cumulative count of Article Views (full-text article views including HTML views, PDF and ePub downloads, according to the available data) and Abstracts Views on Vision4Press platform.
Data correspond to usage on the plateform after 2015. The current usage metrics is available 48-96 hours after online publication and is updated daily on week days.
Initial download of the metrics may take a while.