Fig. 10
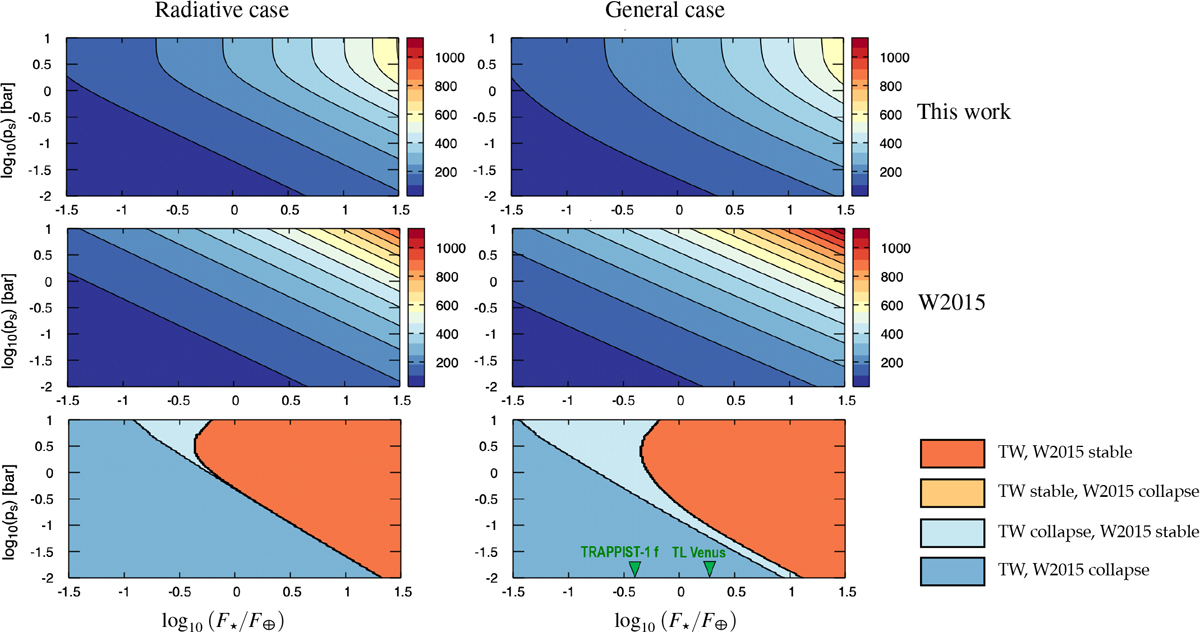
Nightside temperature (K) predicted by analytical theory in this work (top panels) and in Wordsworth (2015) (middle panel), and associated comparative stability diagrams (bottom panels) as functions of logarithms of stellar flux (horizontal axis) and surface pressure (vertical axis). Left: purely radiative case as defined in Sect. 3.3 (Lsen = 0, Ladv = +∞). Right: general case (i.e., with sensible heating and heat transport by stellar and anti-stellar atmospheric circulation). The stellar flux is normalised by the modern Earth’s value F⊕ = 1366 W m−2, and the surface pressure is given in bar. In stability diagrams, the acronyms “TW” and “W2015” are used for “This work” and “Wordsworth (2015)”, respectively. Colours indicate the stability of the steady state predicted by the two models: both models predict stability (orange-red areas); the present model predicts stability while W2015 predicts collapse (orange areas); the present model predicts collapse while W2015 predicts stability (light blue areas); both models predict collapse (blue areas). The incident stellar fluxes of TRAPPIST-1 f and a hypothetical tidally locked Venus are designated by green triangles. These plots are obtained by solving Eqs. (78) and (45) of Wordsworth (2015) with parameters values given by Table 2.
Current usage metrics show cumulative count of Article Views (full-text article views including HTML views, PDF and ePub downloads, according to the available data) and Abstracts Views on Vision4Press platform.
Data correspond to usage on the plateform after 2015. The current usage metrics is available 48-96 hours after online publication and is updated daily on week days.
Initial download of the metrics may take a while.