Fig. A.3.
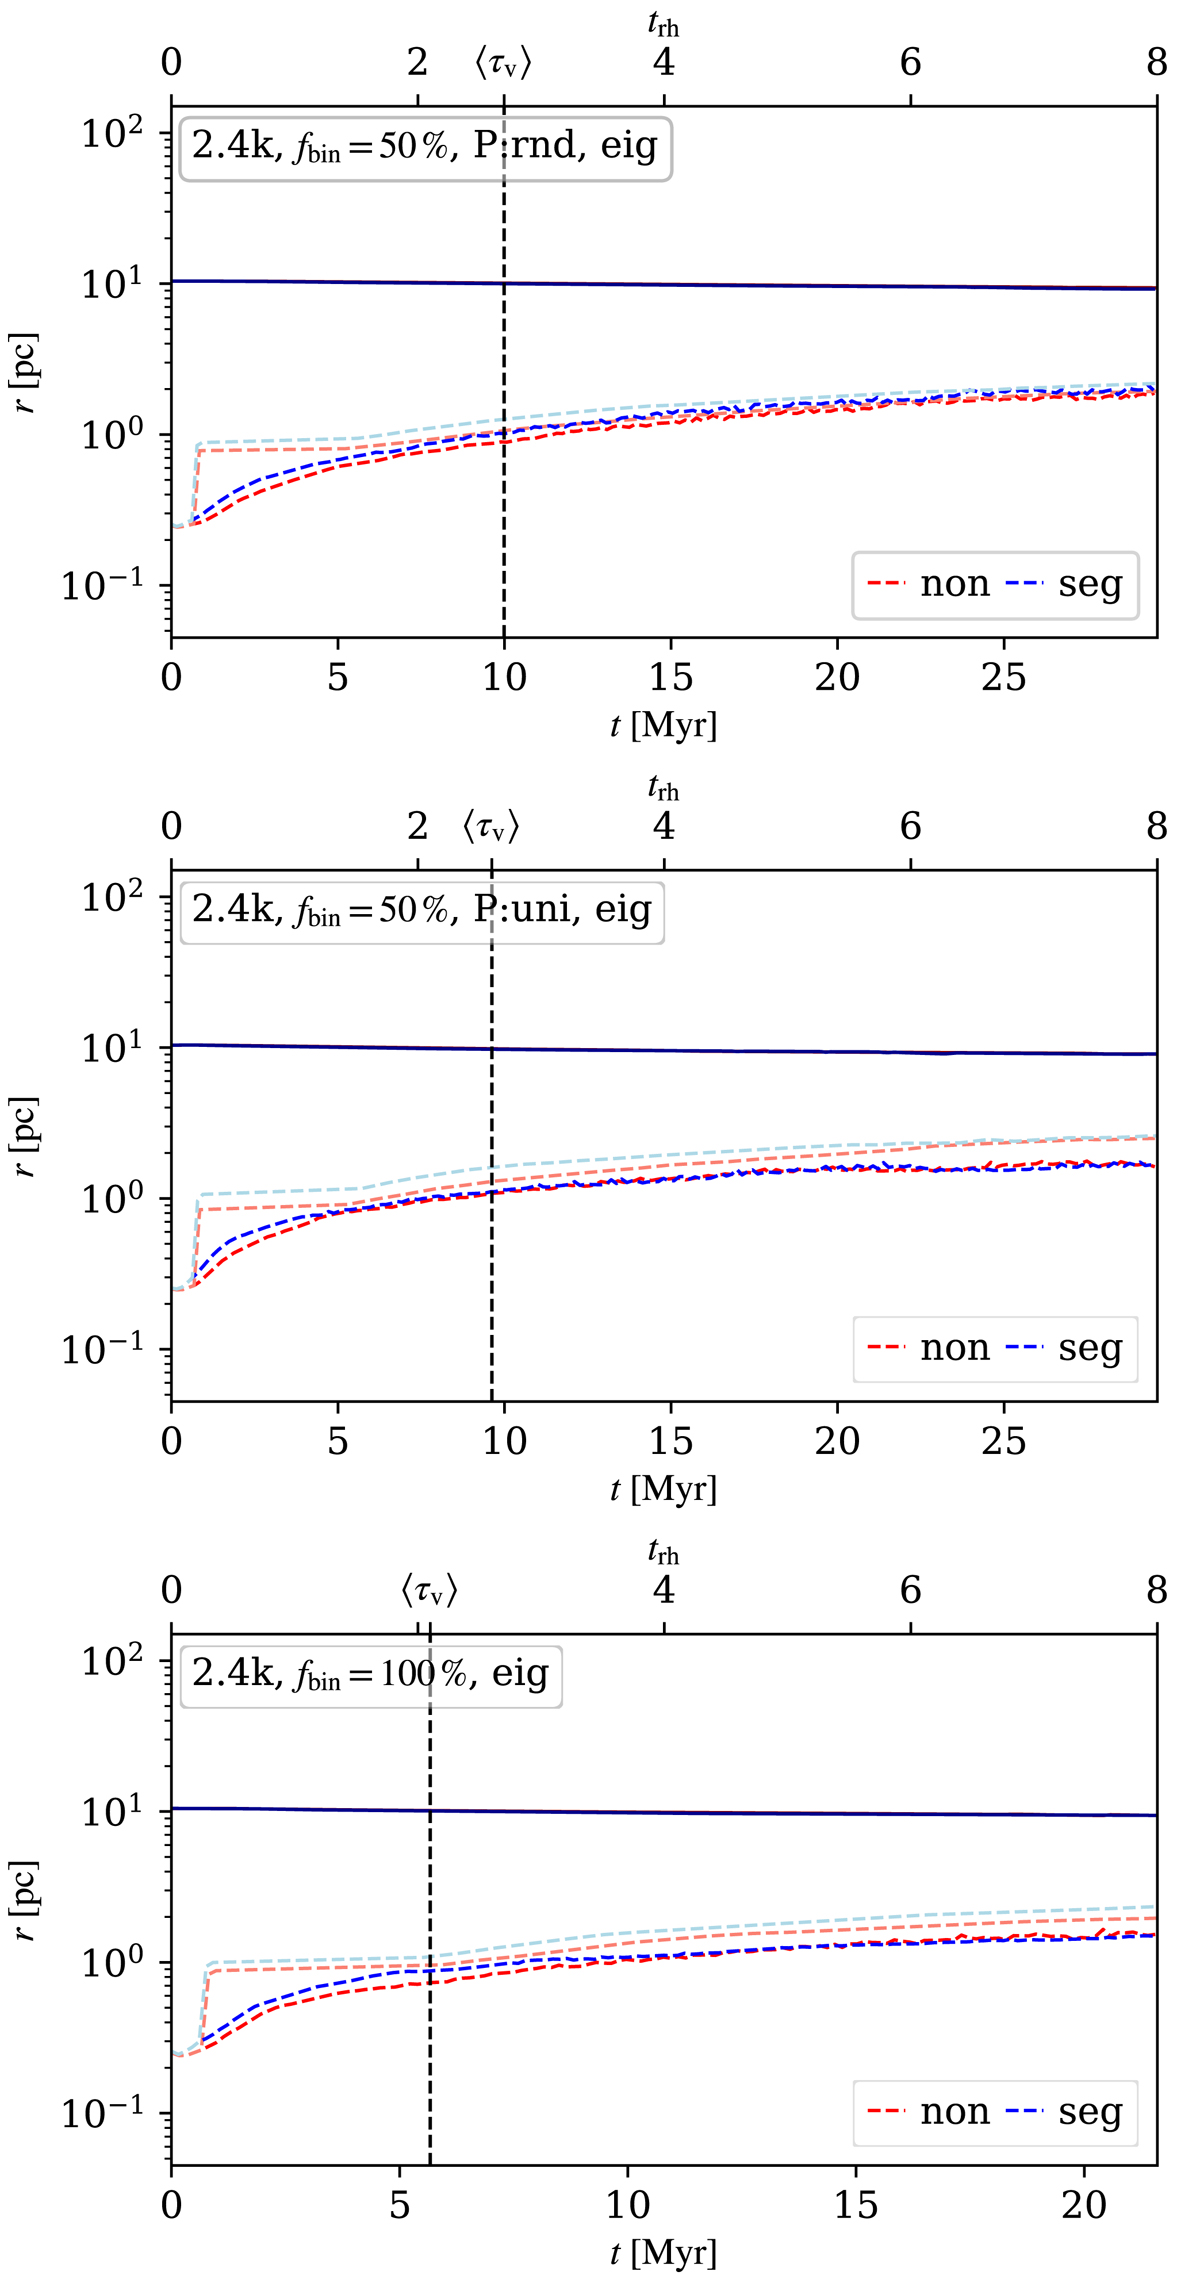
Evolution of the half-mass radius (dashed colour lines) of each model calculated from stars that are bound to the cluster, i.e. up to the tidal radius from Eq. (A.1), which is plotted by a solid line. An artificial half-mass radius, which should represent the cluster evolution after gas expulsion, is plotted by the lighter dashed line for each model. The mean value ⟨τv⟩ of each model is plotted by a dashed vertical line for reference.
Current usage metrics show cumulative count of Article Views (full-text article views including HTML views, PDF and ePub downloads, according to the available data) and Abstracts Views on Vision4Press platform.
Data correspond to usage on the plateform after 2015. The current usage metrics is available 48-96 hours after online publication and is updated daily on week days.
Initial download of the metrics may take a while.