Free Access
Fig. A.1.
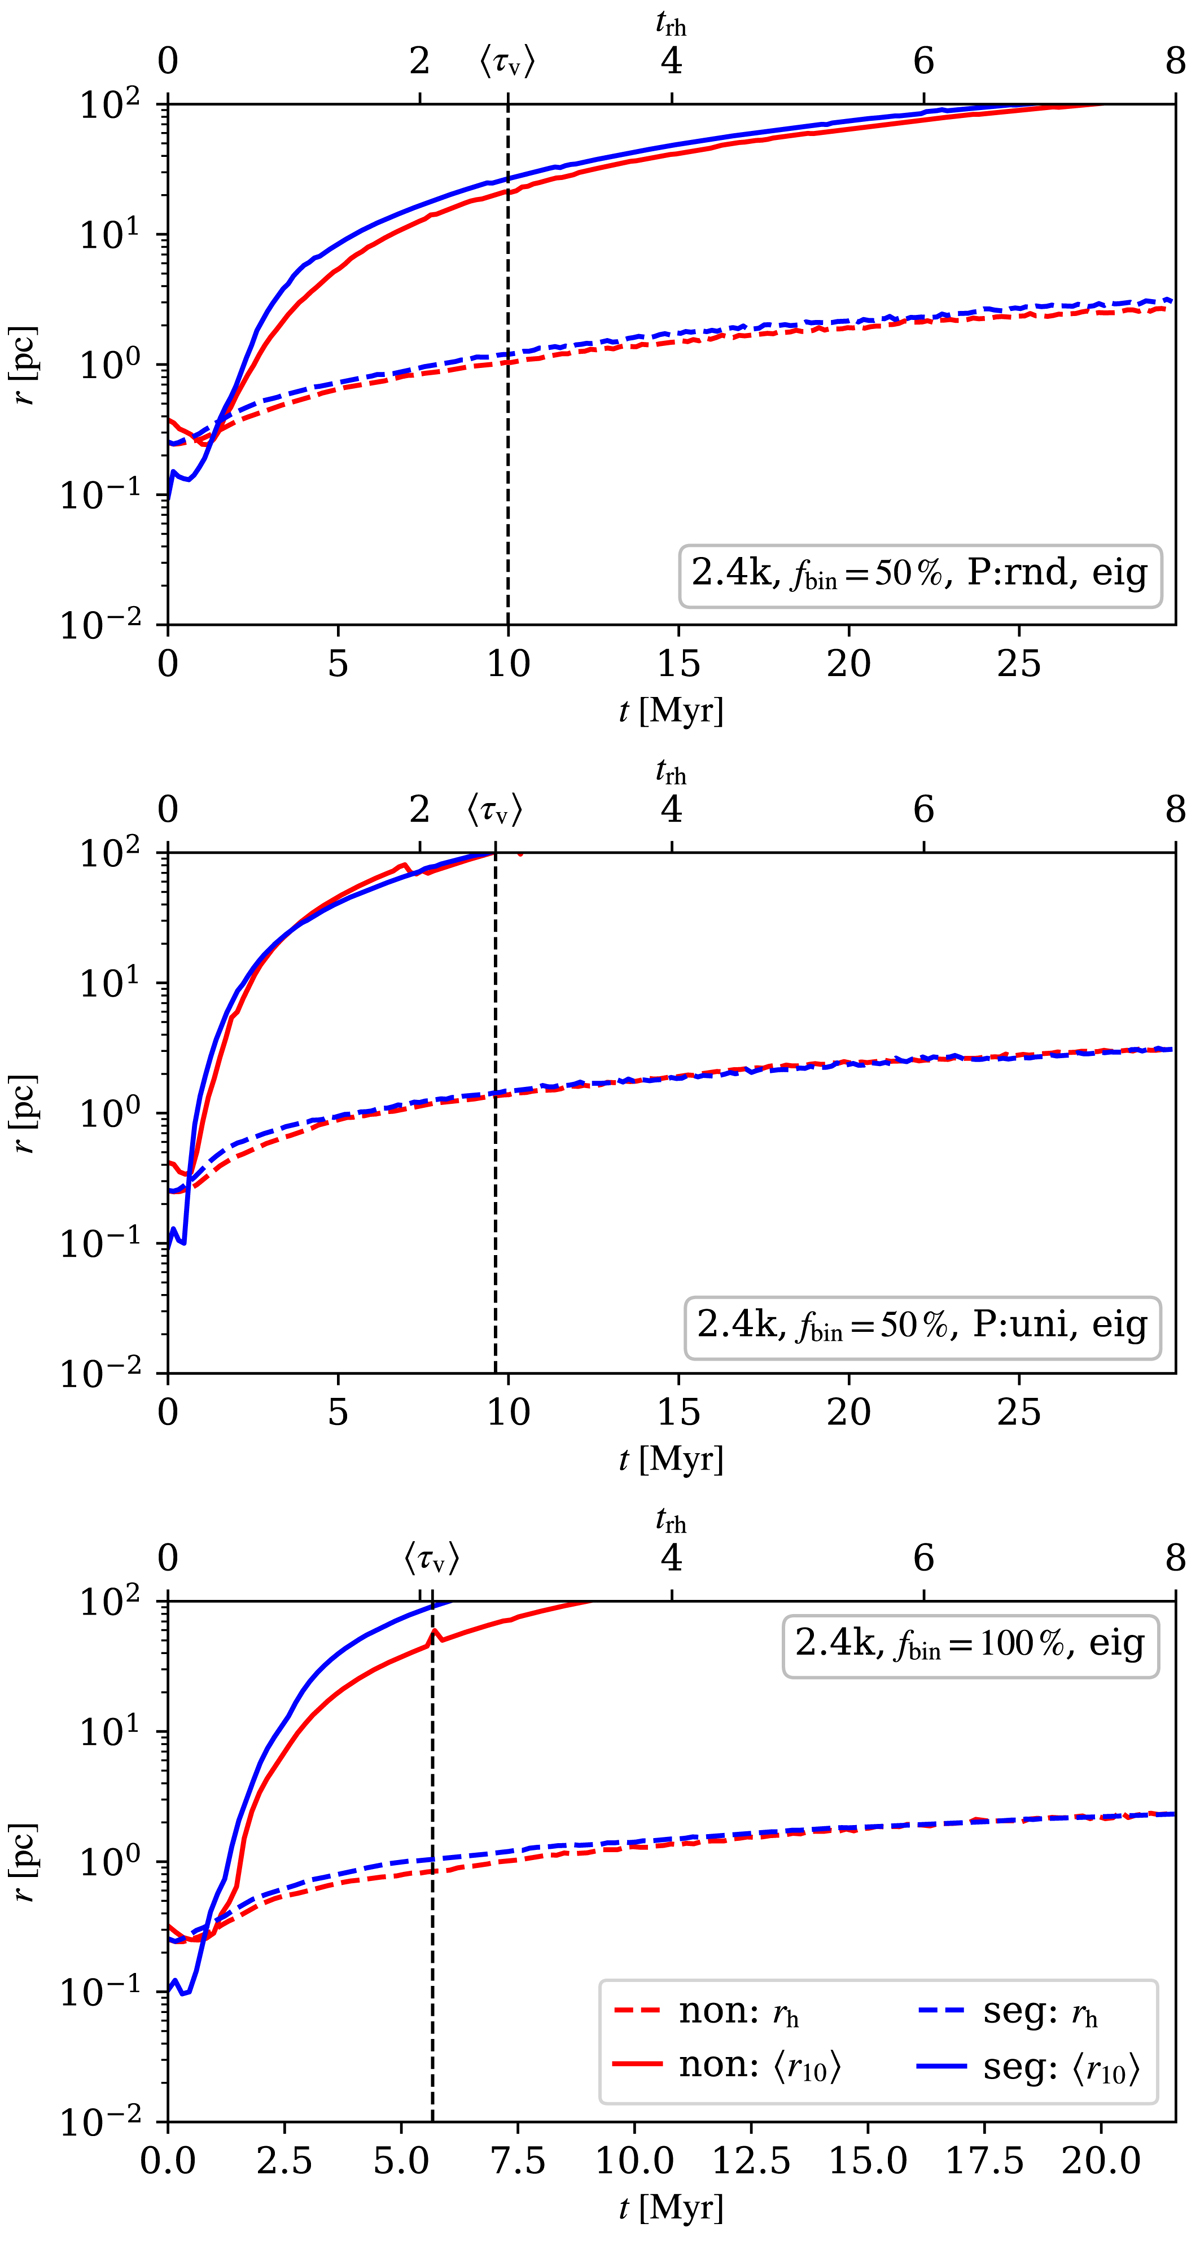
Average positions of the 10 most massive stars in each model. For reference, the half-mass radius is plotted with a dashed colour line, and the mean time ⟨τv⟩ of each model is plotted by a dashed vertical line.
Current usage metrics show cumulative count of Article Views (full-text article views including HTML views, PDF and ePub downloads, according to the available data) and Abstracts Views on Vision4Press platform.
Data correspond to usage on the plateform after 2015. The current usage metrics is available 48-96 hours after online publication and is updated daily on week days.
Initial download of the metrics may take a while.