Fig. 2.
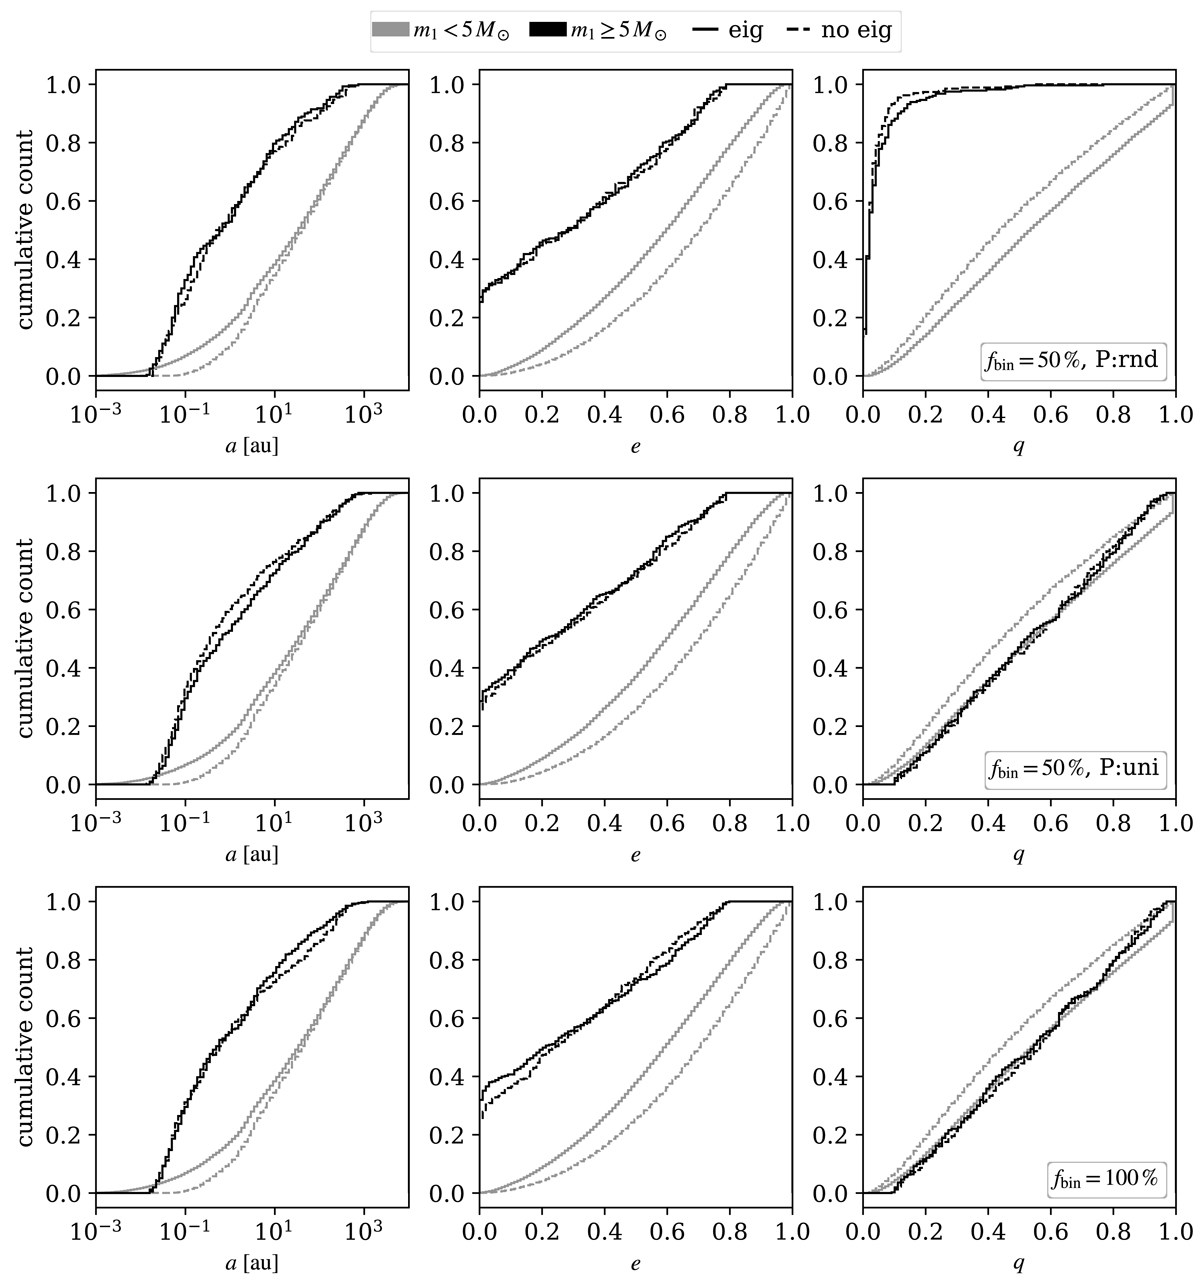
Initial distributions of the semi-major axis, eccentricity and mass ratio of the binary populations used in this work. Two mass groups are distinguished according to the primary component mass: m1 < 5 M⊙ (grey) or m1 ≥ 5 M⊙ (black). Models with (solid line) and without (dashed line) eigenevolution are compared. Models with and without primordial mass segregation (ten realisations each) are combined in each curve.
Current usage metrics show cumulative count of Article Views (full-text article views including HTML views, PDF and ePub downloads, according to the available data) and Abstracts Views on Vision4Press platform.
Data correspond to usage on the plateform after 2015. The current usage metrics is available 48-96 hours after online publication and is updated daily on week days.
Initial download of the metrics may take a while.