Fig. 5
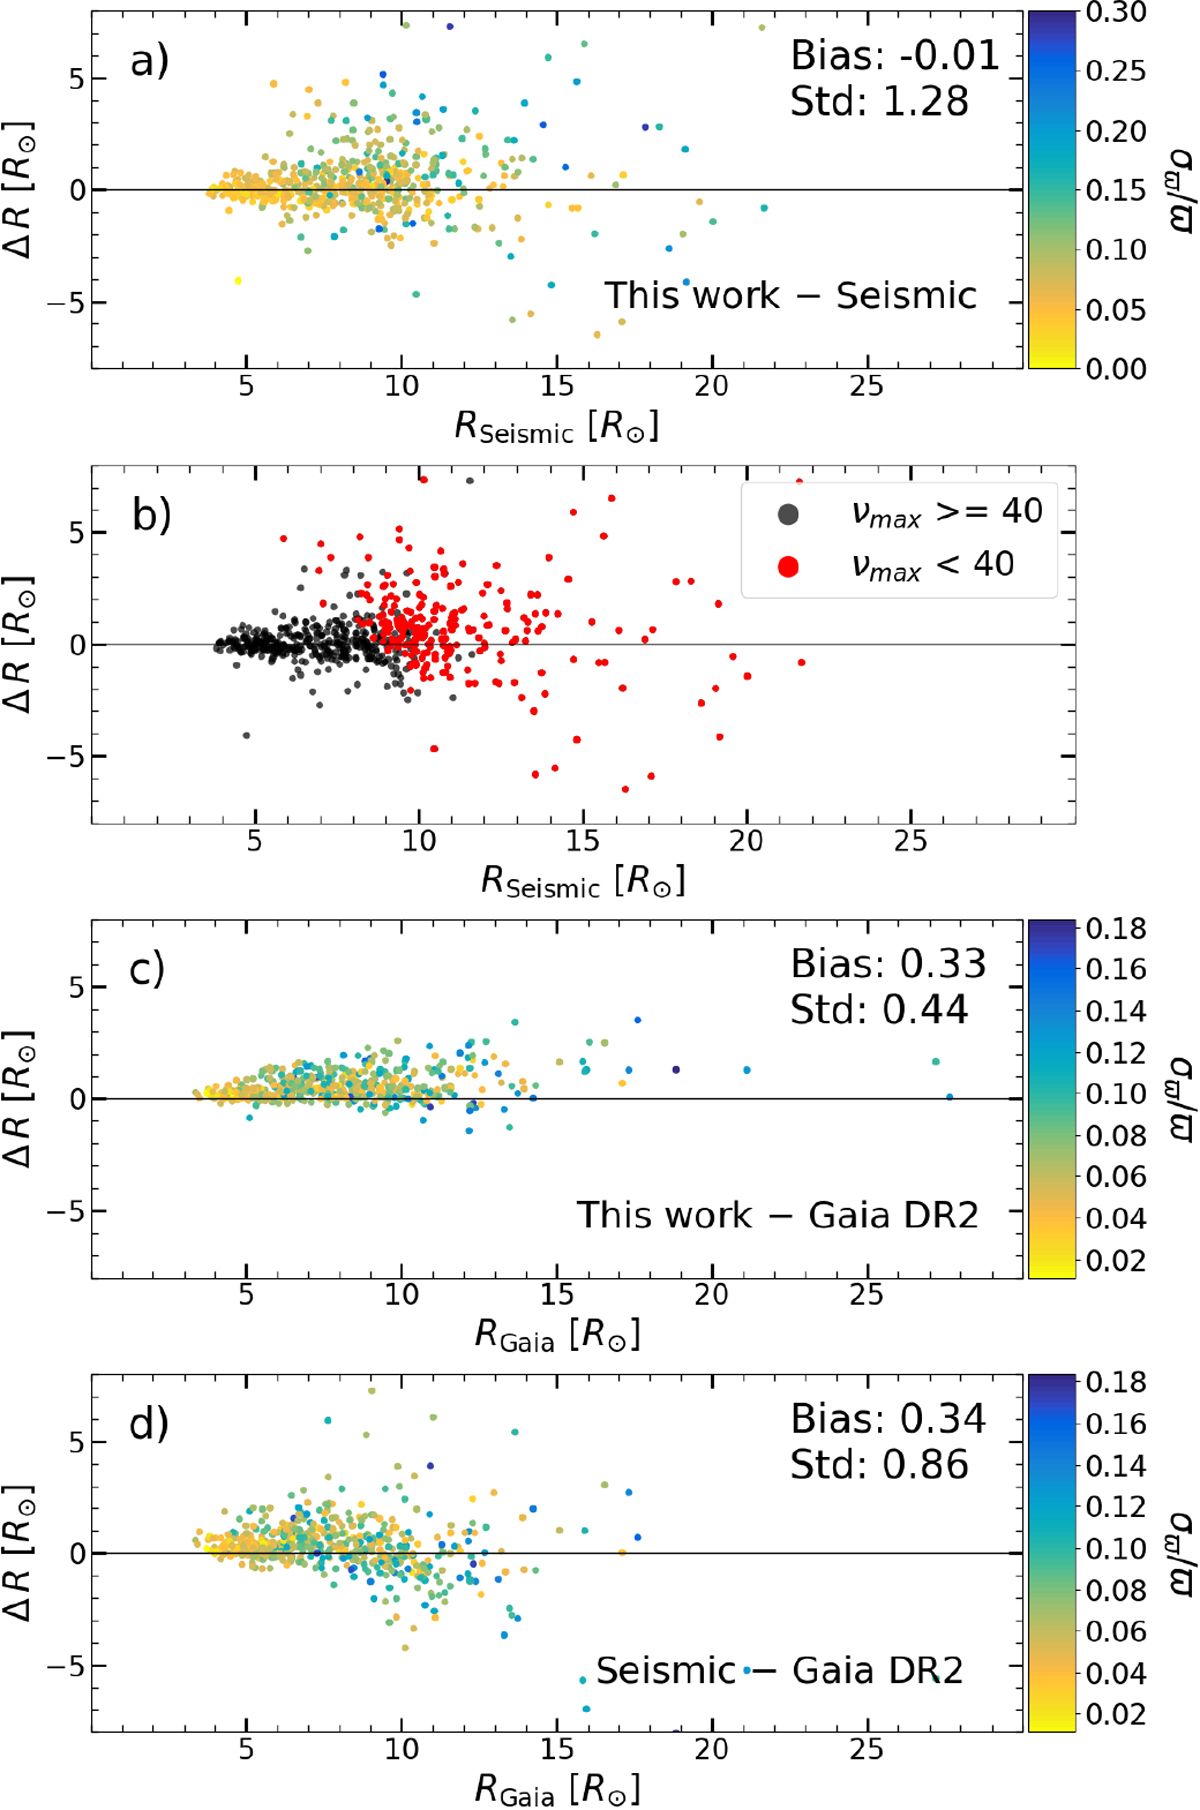
Comparison of radii for the benchmark validation sample derived by the binary pipeline, Gaia DR2, and computed from asteroseismic parameters (more details in Sect. 4.3). The colour-coding is by relative parallax uncertainty except in panel b, which is a copy of panel a, but colour-coded to indicate stars with less reliable seismic information (νmax < 40; S. Sharma, priv. comm.). The more reliable part of the sample is used to calculate the bias and scatter as reported in panels a, c, and d. The colour scale in panel a is clipped for clarity, while panels b and c have a smaller range of σϖ ∕ϖ because some Gaia DR2 values for radii were lacking.
Current usage metrics show cumulative count of Article Views (full-text article views including HTML views, PDF and ePub downloads, according to the available data) and Abstracts Views on Vision4Press platform.
Data correspond to usage on the plateform after 2015. The current usage metrics is available 48-96 hours after online publication and is updated daily on week days.
Initial download of the metrics may take a while.