Fig. 10
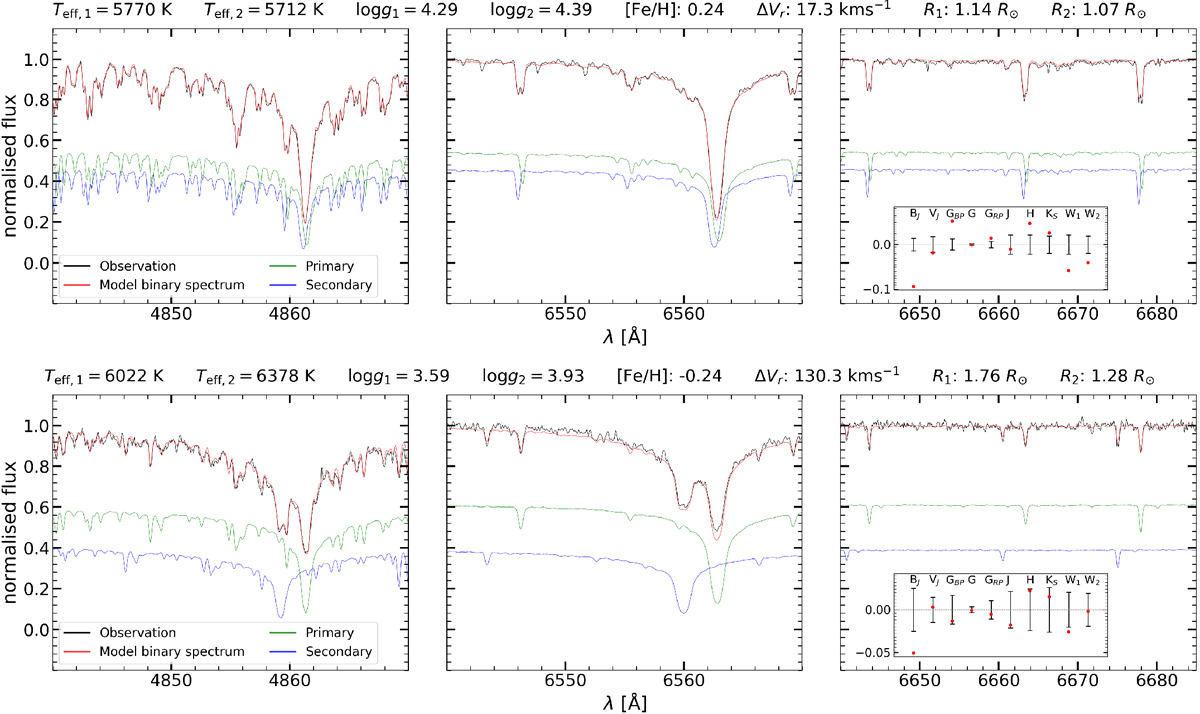
Example fits of binary stars from the final sample. Top and bottom panels: binary system at low- and high-velocity separation of double lines, respectively. The spectral region around Hβ and Hα is shown in the left and middle, respectively, while a region of a few well-isolated lines is shown on the right. Some of the derived θ parameters are indicated for each binary system, and the bottom example shows that the primary star has already evolved from the main-sequence. The primary and secondary component of the modelled binary spectrum are shown separately at a continuum level in accordance with their contribution. The black error bars in the inset plot of the photometricfit represent the relative uncertainty of the observed fluxes in the indicated photometric passbands, while the red points represent the relative offset of synthetic fluxes. The error bars of Gaia photometry are multiplied by a factor of 10 for clarity.
Current usage metrics show cumulative count of Article Views (full-text article views including HTML views, PDF and ePub downloads, according to the available data) and Abstracts Views on Vision4Press platform.
Data correspond to usage on the plateform after 2015. The current usage metrics is available 48-96 hours after online publication and is updated daily on week days.
Initial download of the metrics may take a while.