Fig. 1
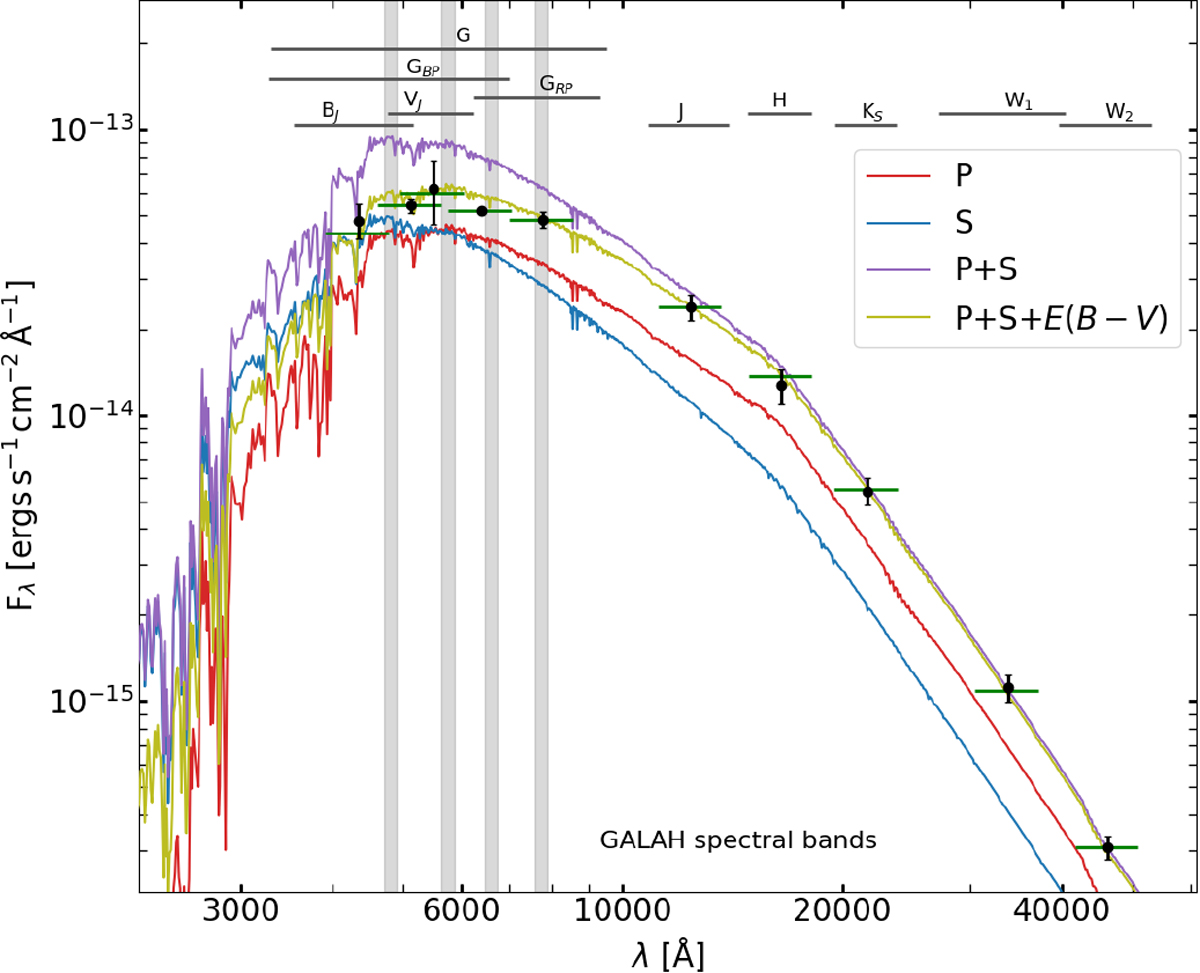
Spectral energy distributions for an example of a binary system (Teff,1 = 5018 K, Teff,2 = 5715 K, R1 = 1.9 R⊙, R2 = 1.3 R⊙, E(B− V) = 0.13). The legend explains which SEDs are plotted (P is the primary star, and S is the secondary star). The four GALAH spectral bands are indicated by vertical shaded regions, while the width of the transmission functions of photometric bands is indicated on the top. The black points are observed integrated fluxes in the following order of photometric bands: BJ, GBP, VJ, G, GRP, J, H, KS, W1, and W2 (see Sect. 3.2.2), and the short green lines indicate the synthetic integrated fluxes at the same position. The error bars of observed fluxes are exaggerated by a factor of 10 for clarity. Despite this, the uncertainty for the Gaia G value is smaller than the point size.
Current usage metrics show cumulative count of Article Views (full-text article views including HTML views, PDF and ePub downloads, according to the available data) and Abstracts Views on Vision4Press platform.
Data correspond to usage on the plateform after 2015. The current usage metrics is available 48-96 hours after online publication and is updated daily on week days.
Initial download of the metrics may take a while.