Free Access
Fig. A.1.
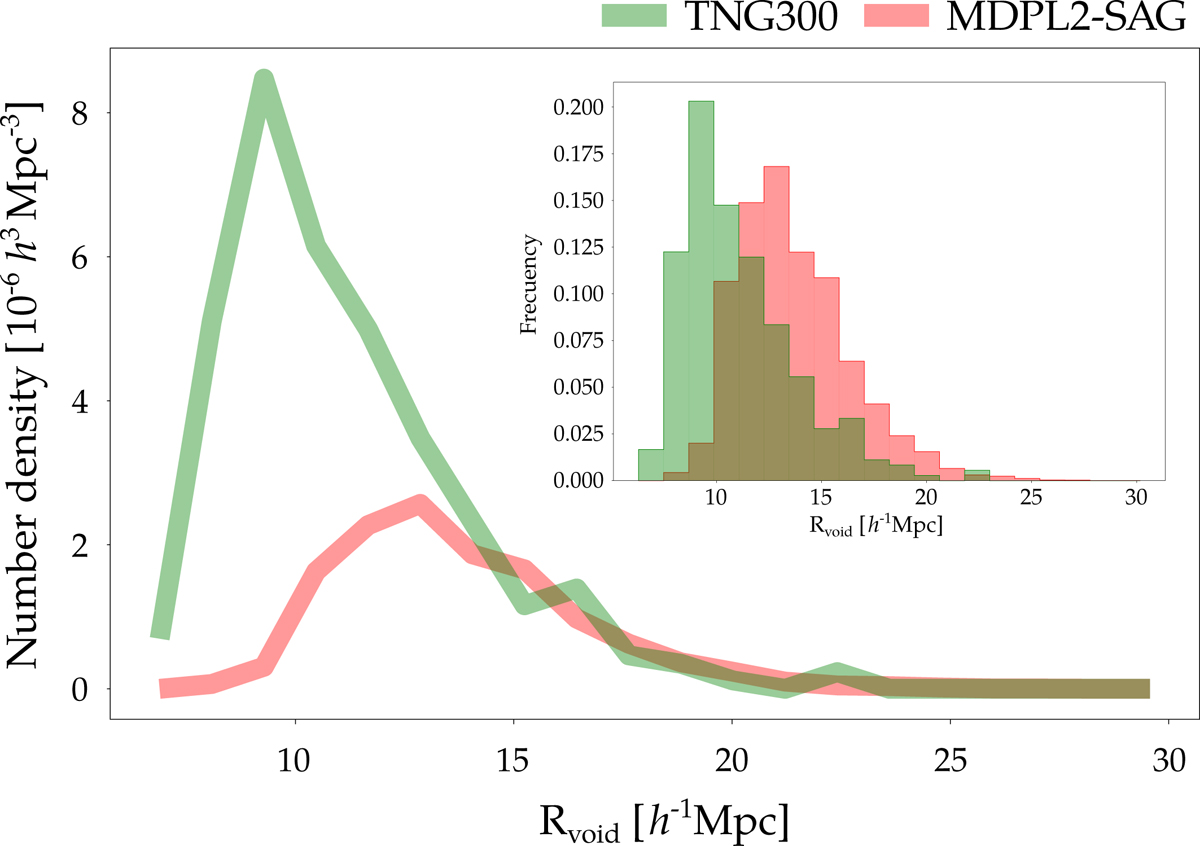
Volume number density of voids as a function of void sizes. Green and red curves correspond to TNG300 and MDPL2-SAG catalogues, respectively. The inset figures show the size distributions for both catalogues.
Current usage metrics show cumulative count of Article Views (full-text article views including HTML views, PDF and ePub downloads, according to the available data) and Abstracts Views on Vision4Press platform.
Data correspond to usage on the plateform after 2015. The current usage metrics is available 48-96 hours after online publication and is updated daily on week days.
Initial download of the metrics may take a while.