Free Access
Fig. 8.
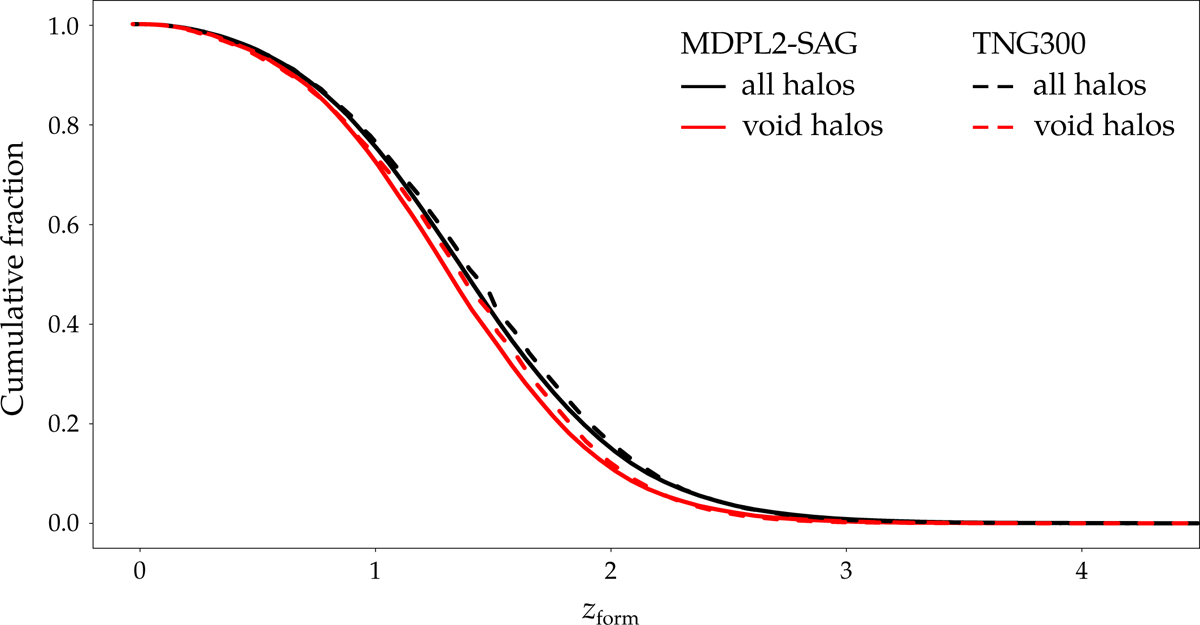
Cumulative fraction of the formation redshift of haloes, zform, for MDPL2-SAG (solid lines) and TNG300 (dashed lines) catalogues. Both panels show the distribution for haloes inside voids (red lines) and all haloes (black lines).
Current usage metrics show cumulative count of Article Views (full-text article views including HTML views, PDF and ePub downloads, according to the available data) and Abstracts Views on Vision4Press platform.
Data correspond to usage on the plateform after 2015. The current usage metrics is available 48-96 hours after online publication and is updated daily on week days.
Initial download of the metrics may take a while.