Fig. 7.
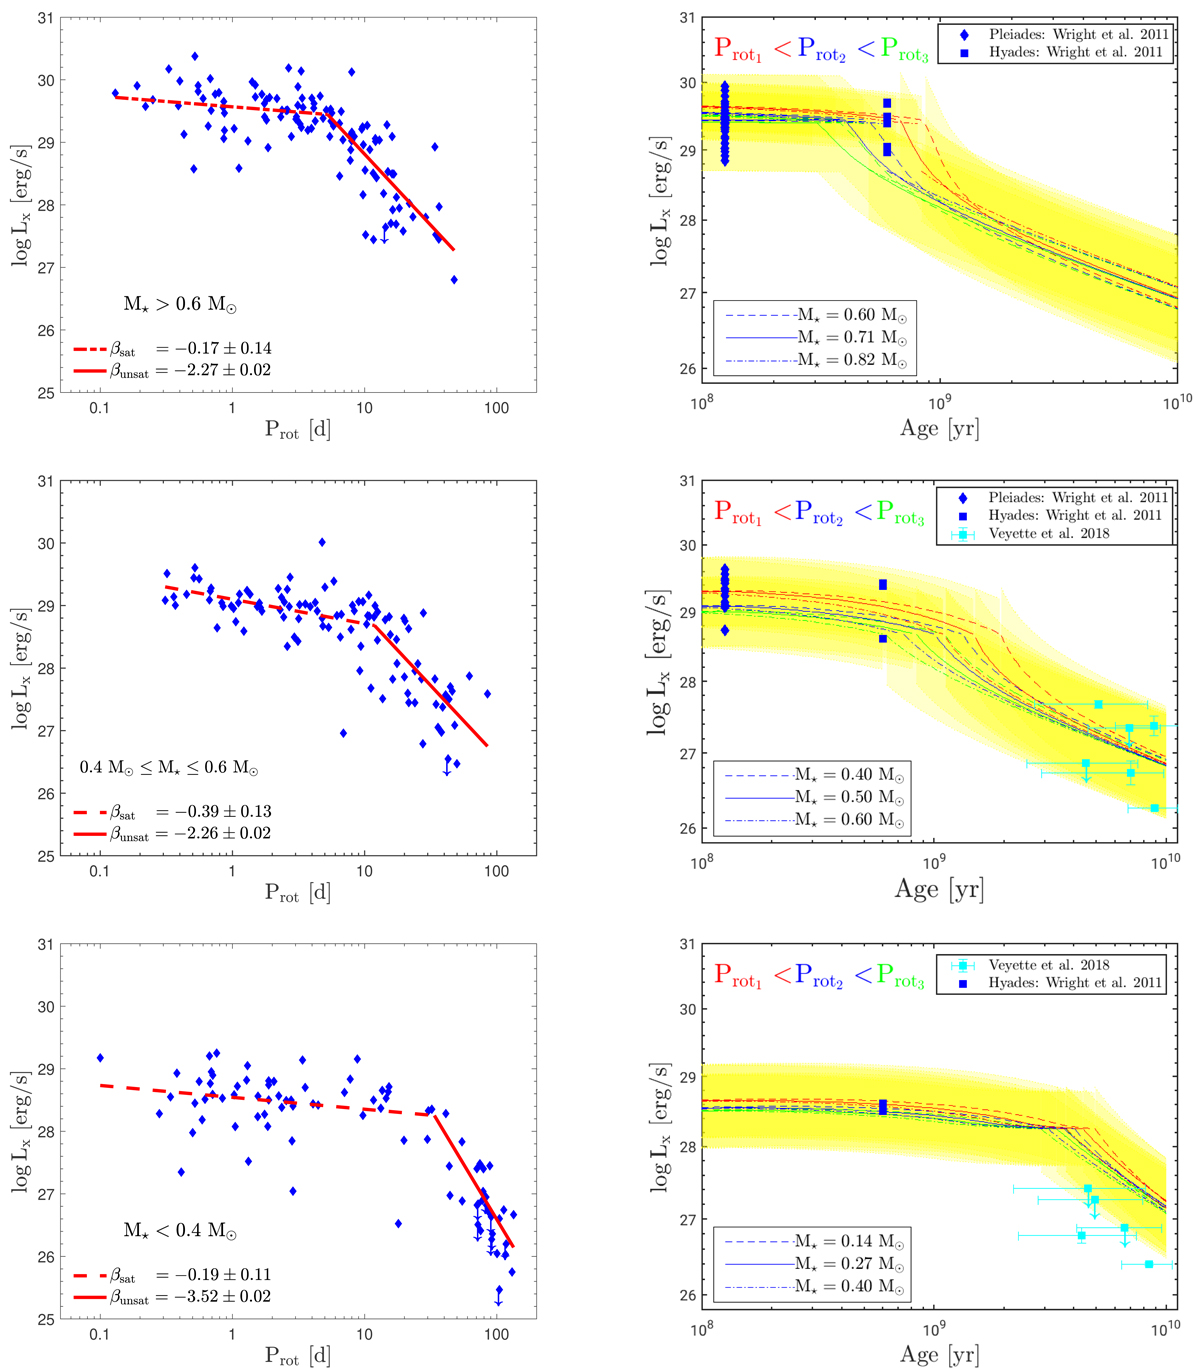
Left: results of the activity-rotation relation fitting for the three mass ranges considered in this work. Right: retrieved Lx-age relation from angular evolution models for the same mass bins together with M dwarfs with known ages from the literature by Wright et al. (2011) (blue points) and Veyette & Muirhead (2018) (squared cyan). The yellow region shows the vertical Lx-spread from the standard deviation of the observed Lx − Prot relation. Three different initial rotation periods are shown: Prot, 1 = 1.54 d (red line), Prot, 2 = 5.51 d (blue line), and Prot, 3 = 8.83 d (green line). In the predicted Lx-age relation we show the model for the central mass bin (solid line), together with the lower and upper mass boundaries (dashed and dotted line, respectively).
Current usage metrics show cumulative count of Article Views (full-text article views including HTML views, PDF and ePub downloads, according to the available data) and Abstracts Views on Vision4Press platform.
Data correspond to usage on the plateform after 2015. The current usage metrics is available 48-96 hours after online publication and is updated daily on week days.
Initial download of the metrics may take a while.