Free Access
Fig. 2.
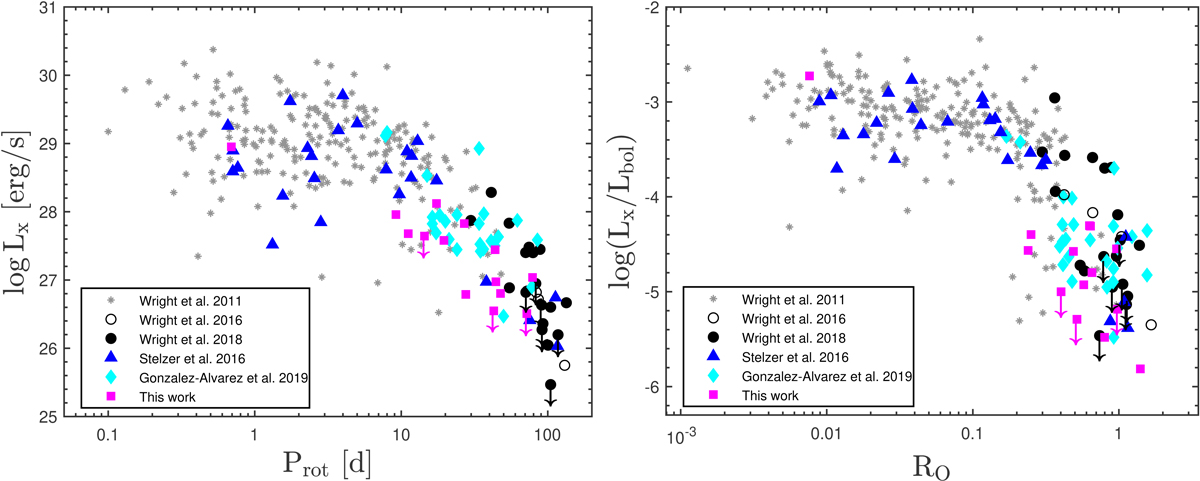
Left: relation of activity to rotation in Lx − Prot space. The color scale is based on the origin of the sample, as explained in the inset. Right: same as the left panel, but for Lx/Lbol vs. Rossby number.
Current usage metrics show cumulative count of Article Views (full-text article views including HTML views, PDF and ePub downloads, according to the available data) and Abstracts Views on Vision4Press platform.
Data correspond to usage on the plateform after 2015. The current usage metrics is available 48-96 hours after online publication and is updated daily on week days.
Initial download of the metrics may take a while.