Fig. 4
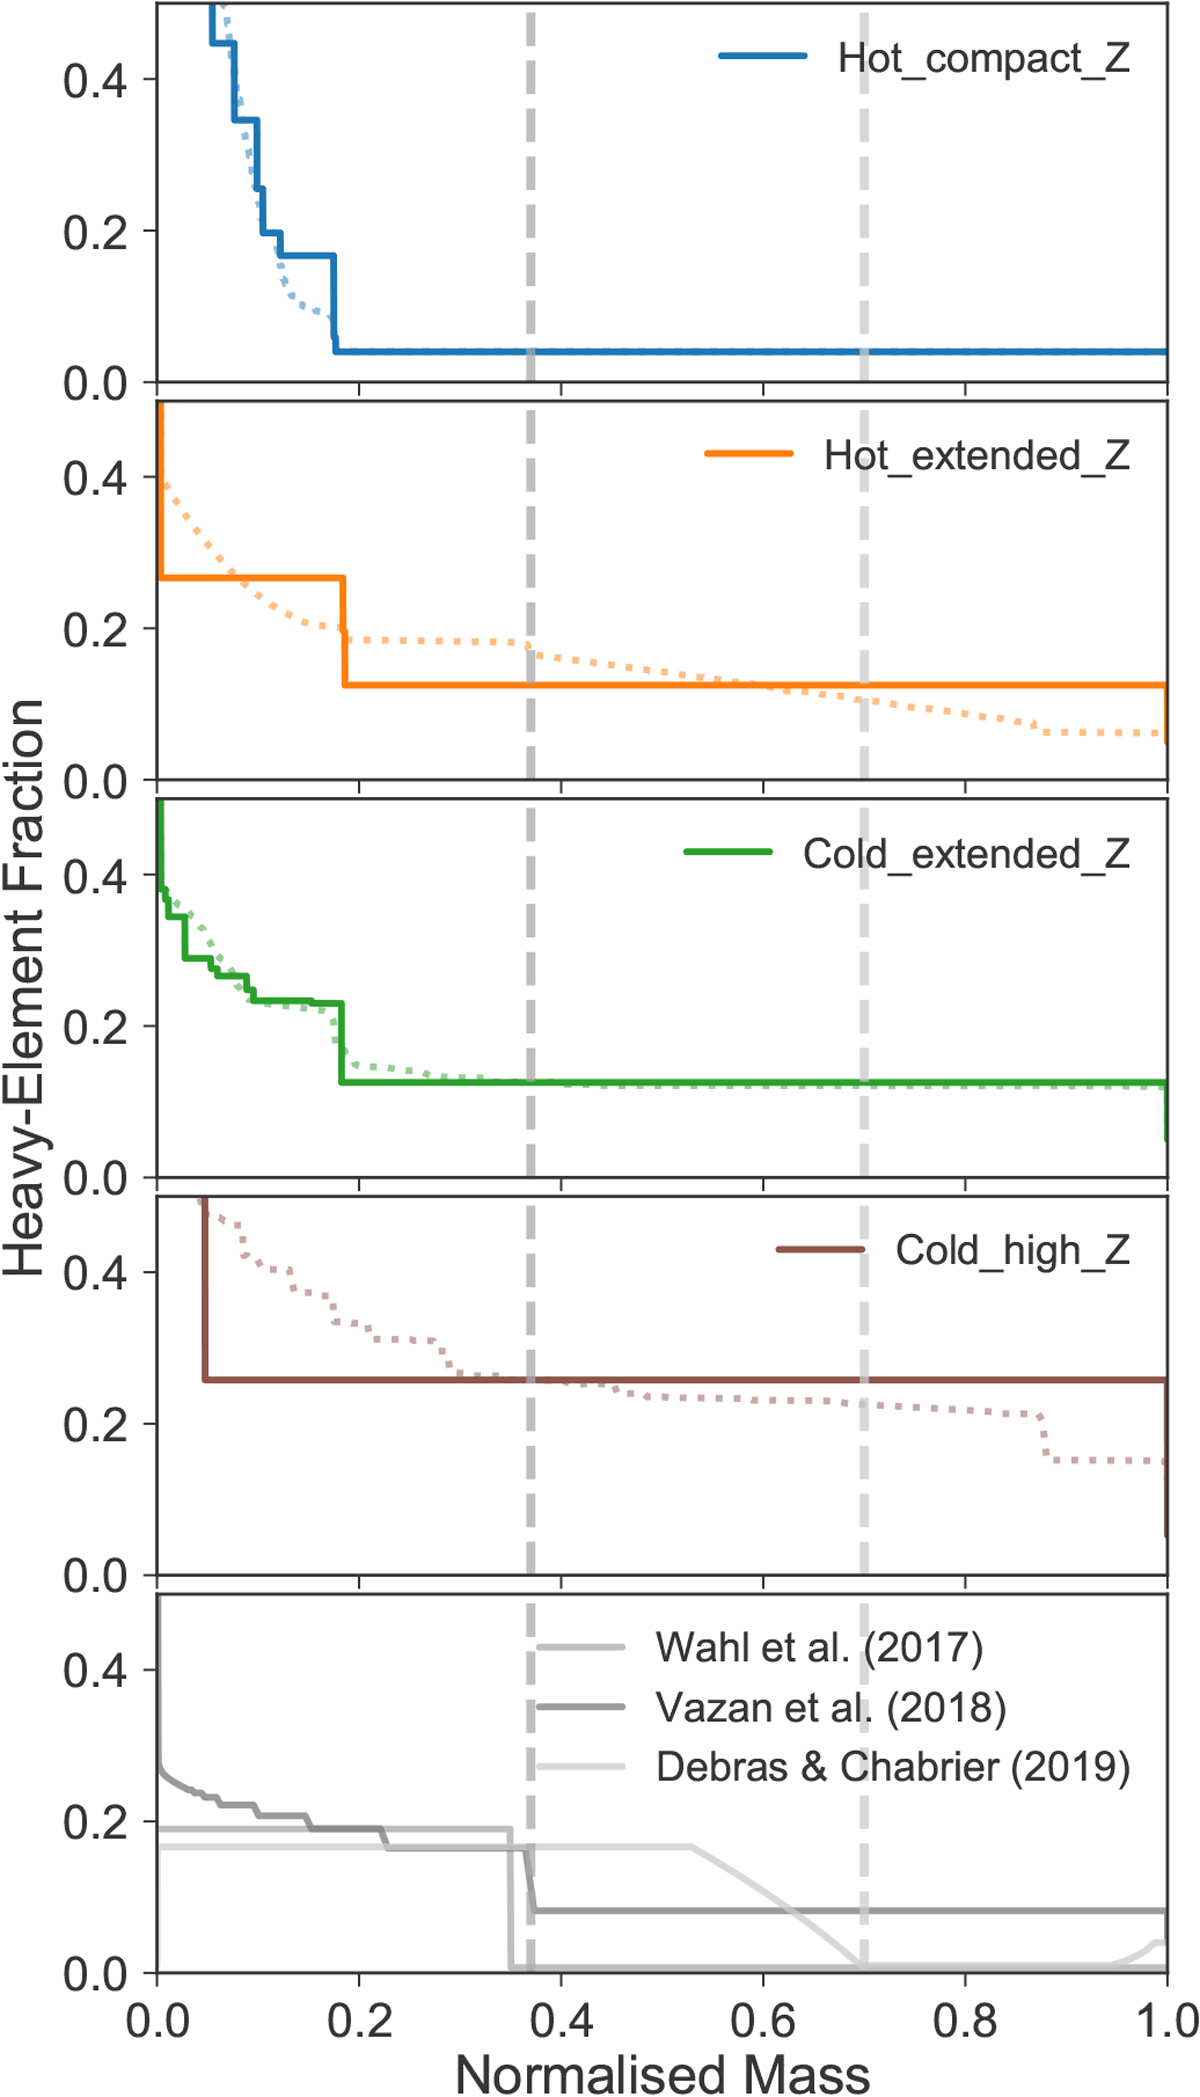
Heavy-element mass fraction vs. normalised mass of Jupiter shortly after its formation (dashed coloured lines) and today (solid coloured lines). The different panels (and colours) show the different formation pathways we consider. The grey vertical dashed lines indicate the extent of the dilute-coreregion as inferred by recent evolution (Vazan et al. 2018) and structure models (Wahl et al. 2017; Debras & Chabrier 2019). In all of our models, the dilute-core region is substantially smaller by ≲ 50% by mass. The bottom panel shows the heavy-element distribution of these published models (solid grey lines).
Current usage metrics show cumulative count of Article Views (full-text article views including HTML views, PDF and ePub downloads, according to the available data) and Abstracts Views on Vision4Press platform.
Data correspond to usage on the plateform after 2015. The current usage metrics is available 48-96 hours after online publication and is updated daily on week days.
Initial download of the metrics may take a while.