Fig. 3.
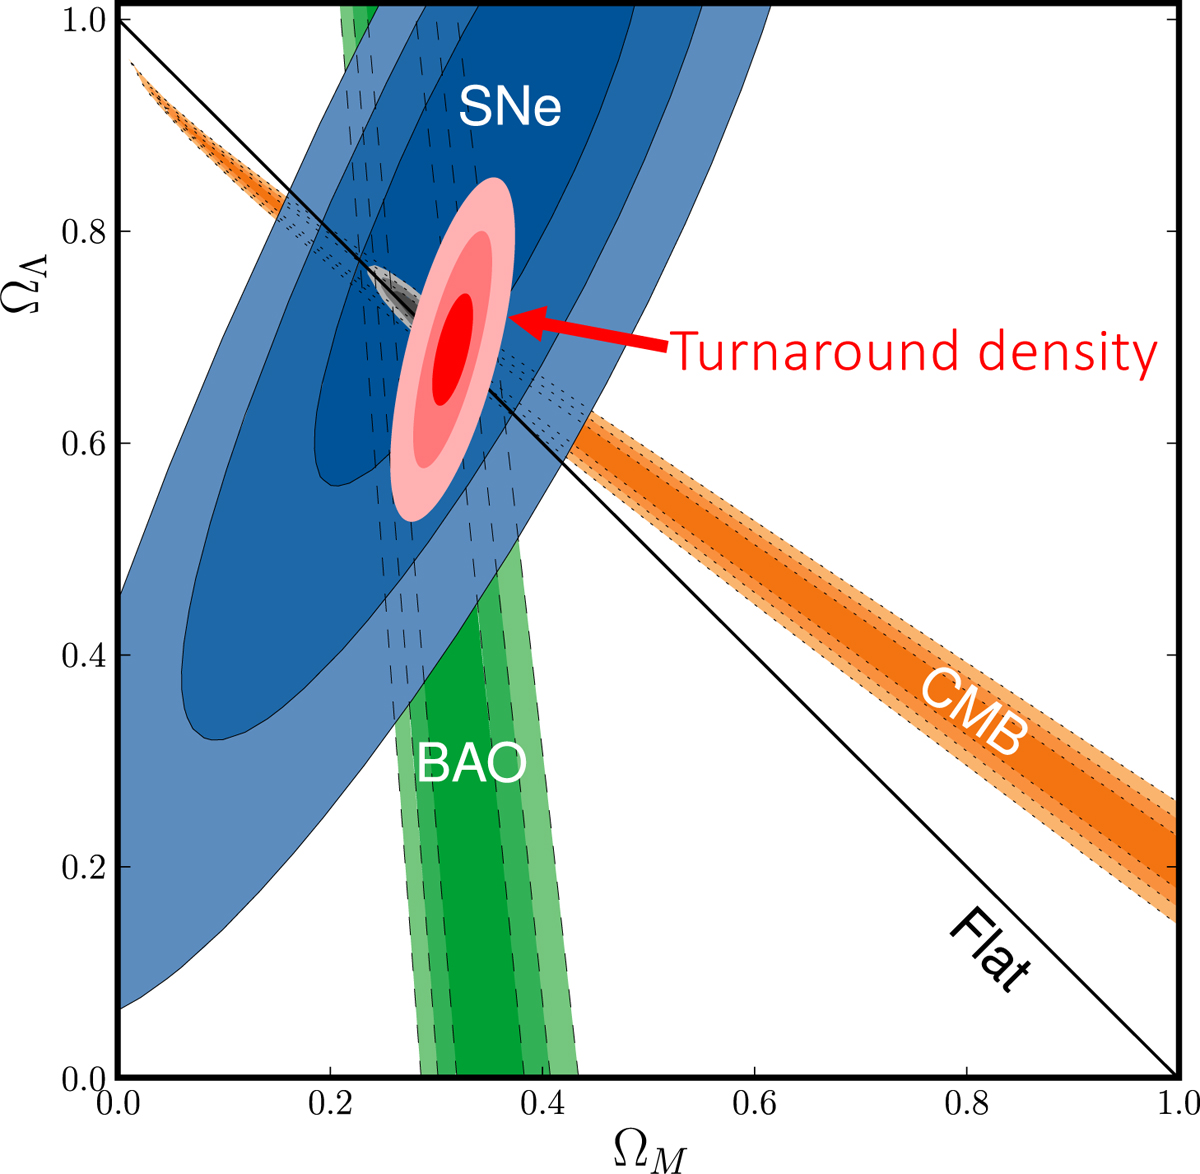
Red and pink contours: projected 1, 2, and 3σ confidence intervals on Ωm, 0 and ΩΛ, 0 from turnaround density data only, obtained by combining the constraints from Eqs. (8) and (10) shown in Fig. 2. As in Fig. 2, the contours are over-plotted on Fig. 10 of Amanullah et al. (2010) showing constraints from supernovae (blue), the CMB (orange), and baryon acoustic oscillations (green).
Current usage metrics show cumulative count of Article Views (full-text article views including HTML views, PDF and ePub downloads, according to the available data) and Abstracts Views on Vision4Press platform.
Data correspond to usage on the plateform after 2015. The current usage metrics is available 48-96 hours after online publication and is updated daily on week days.
Initial download of the metrics may take a while.