Fig. 9.
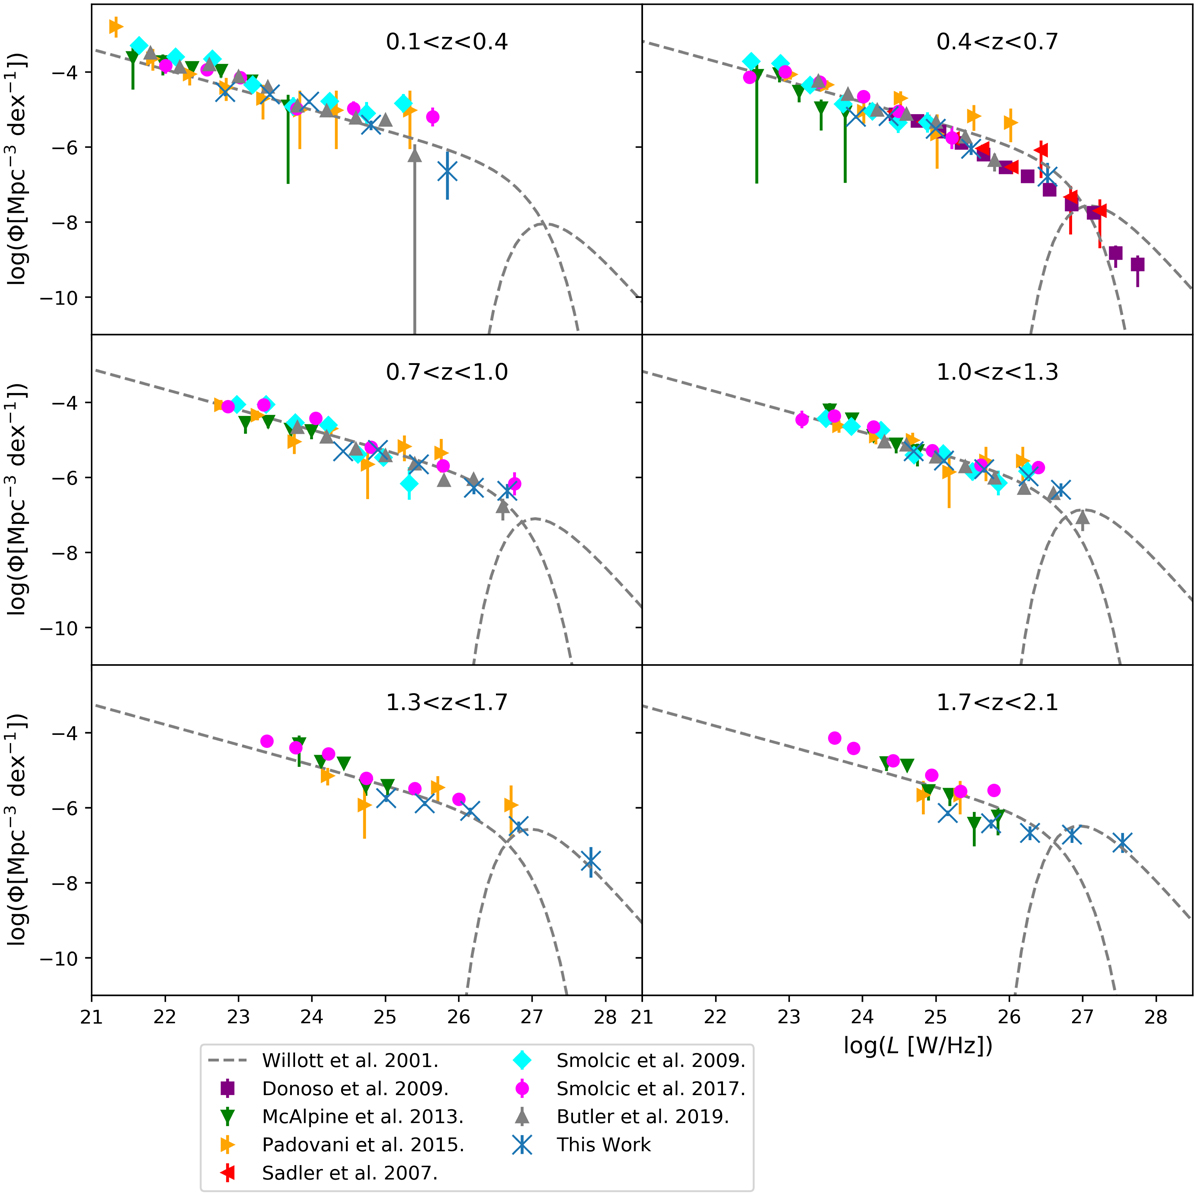
Luminosity functions of this work along with previous ones at 1.4 GHz, as denoted in the legend. The dashed lines represent the bimodal model discussed in the text. This model consists of a high- and a low-luminosity end with different functional dependencies. It can be seen that at higher luminosities, the high-luminosity end of the model traces the data points well.
Current usage metrics show cumulative count of Article Views (full-text article views including HTML views, PDF and ePub downloads, according to the available data) and Abstracts Views on Vision4Press platform.
Data correspond to usage on the plateform after 2015. The current usage metrics is available 48-96 hours after online publication and is updated daily on week days.
Initial download of the metrics may take a while.