Fig. 8.
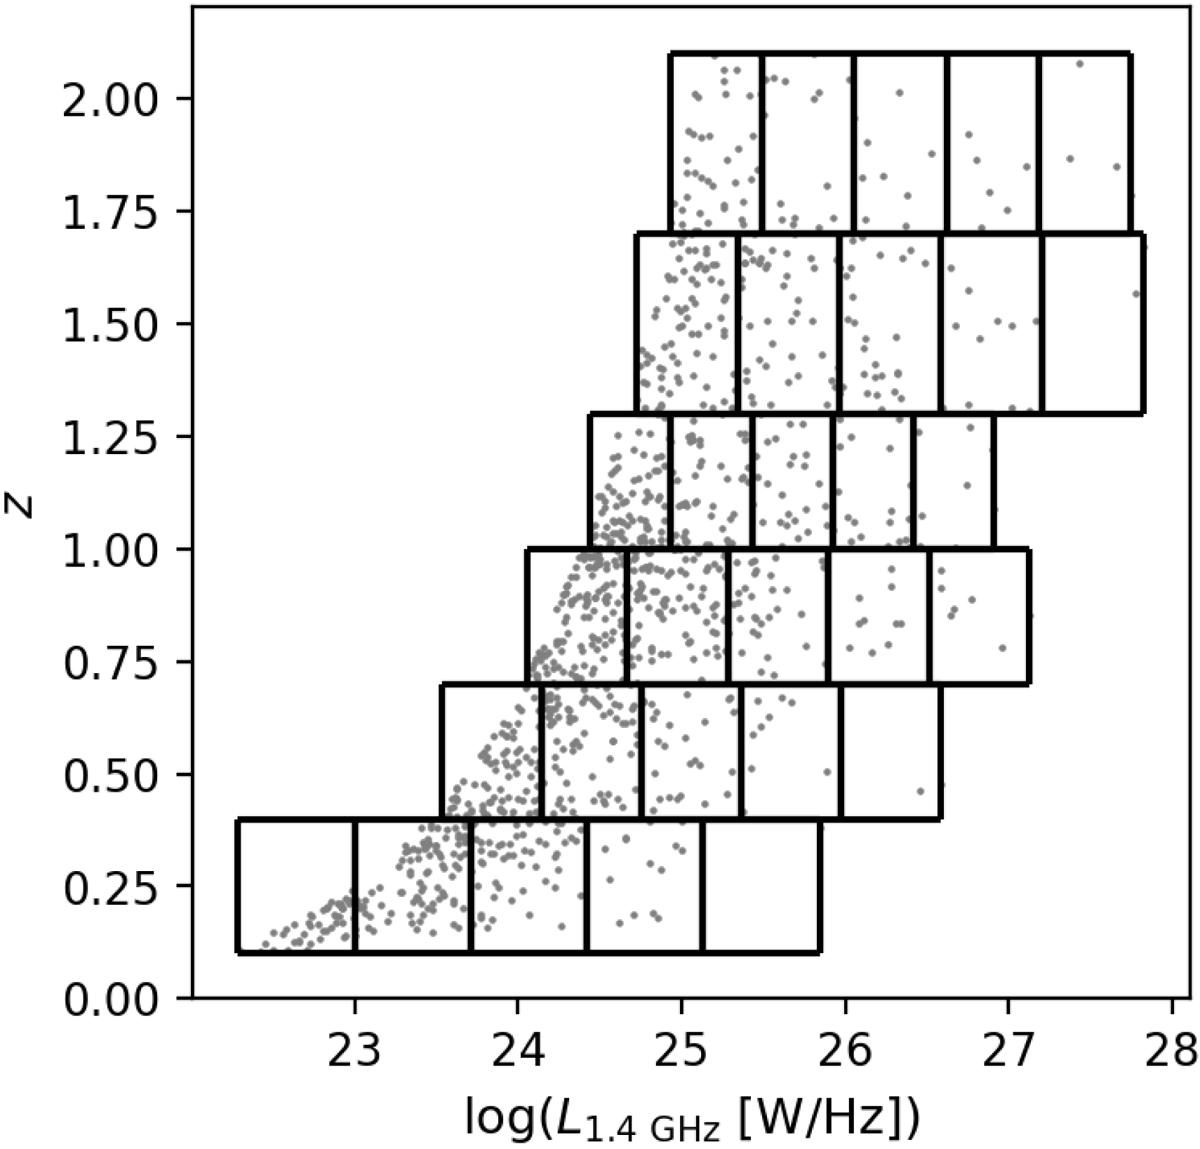
Visual representation of the bins used in the creation of the luminosity functions. The gray dots represent the sources. The black lines correspond to the bin limits in redshift and luminosity. The absence of low-luminosity bins with only few sources is clearly visible. On the high-luminosity end the number of sources per bin decreases, but this effect is a consequence of the intrinsic lower density of high-luminosity sources and cannot be easily corrected.
Current usage metrics show cumulative count of Article Views (full-text article views including HTML views, PDF and ePub downloads, according to the available data) and Abstracts Views on Vision4Press platform.
Data correspond to usage on the plateform after 2015. The current usage metrics is available 48-96 hours after online publication and is updated daily on week days.
Initial download of the metrics may take a while.