Fig. 7.
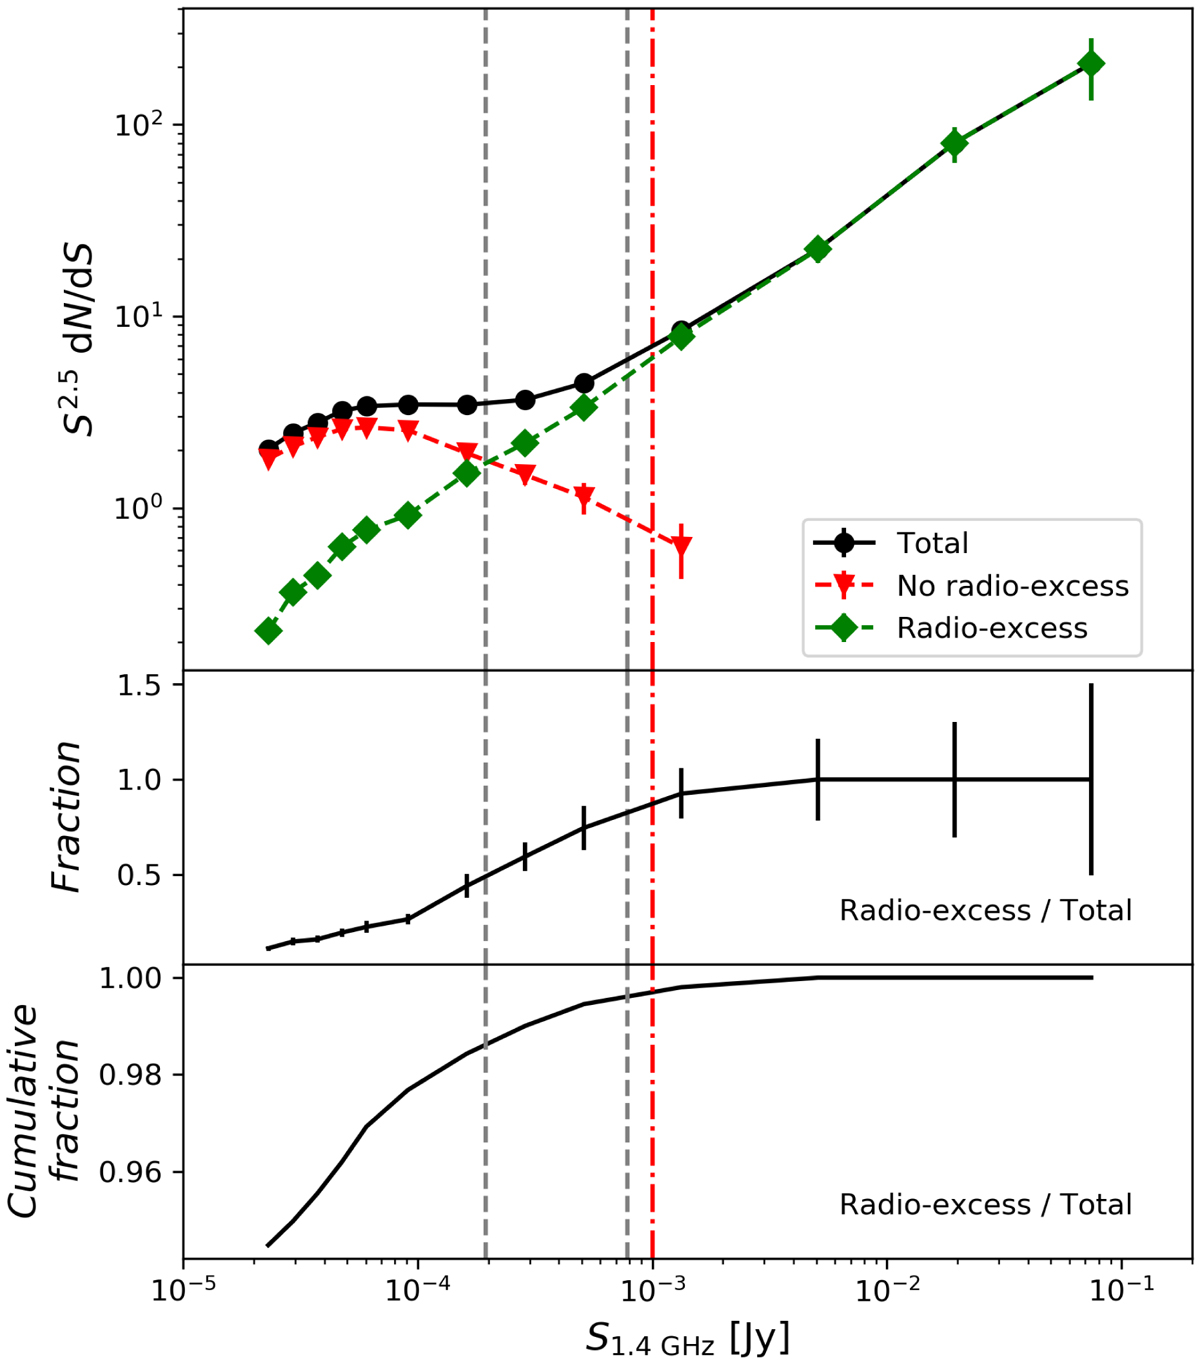
Top panel: Euclidean-normalized and completeness-corrected source counts for different galaxy populations at 1.4 GHz reproduced from Smolčić et al. (2017b), as described in the text (symbols indicated in the legend). The vertical gray lines correspond to the 7σ detection limits of the inner and outer part of the XXL–North GMRT survey recalculated from 610 MHz by presuming a power law for the radio emission (see Sect. 1) and a spectral index of −0.7. Middle panel: fraction of the radio-excess population. Lower panel: cumulative fraction of the radio-excess population summed from higher fluxes towards lower. The red dot-dashed line denotes the adopted flux threshold described in the text.
Current usage metrics show cumulative count of Article Views (full-text article views including HTML views, PDF and ePub downloads, according to the available data) and Abstracts Views on Vision4Press platform.
Data correspond to usage on the plateform after 2015. The current usage metrics is available 48-96 hours after online publication and is updated daily on week days.
Initial download of the metrics may take a while.