Fig. 6.
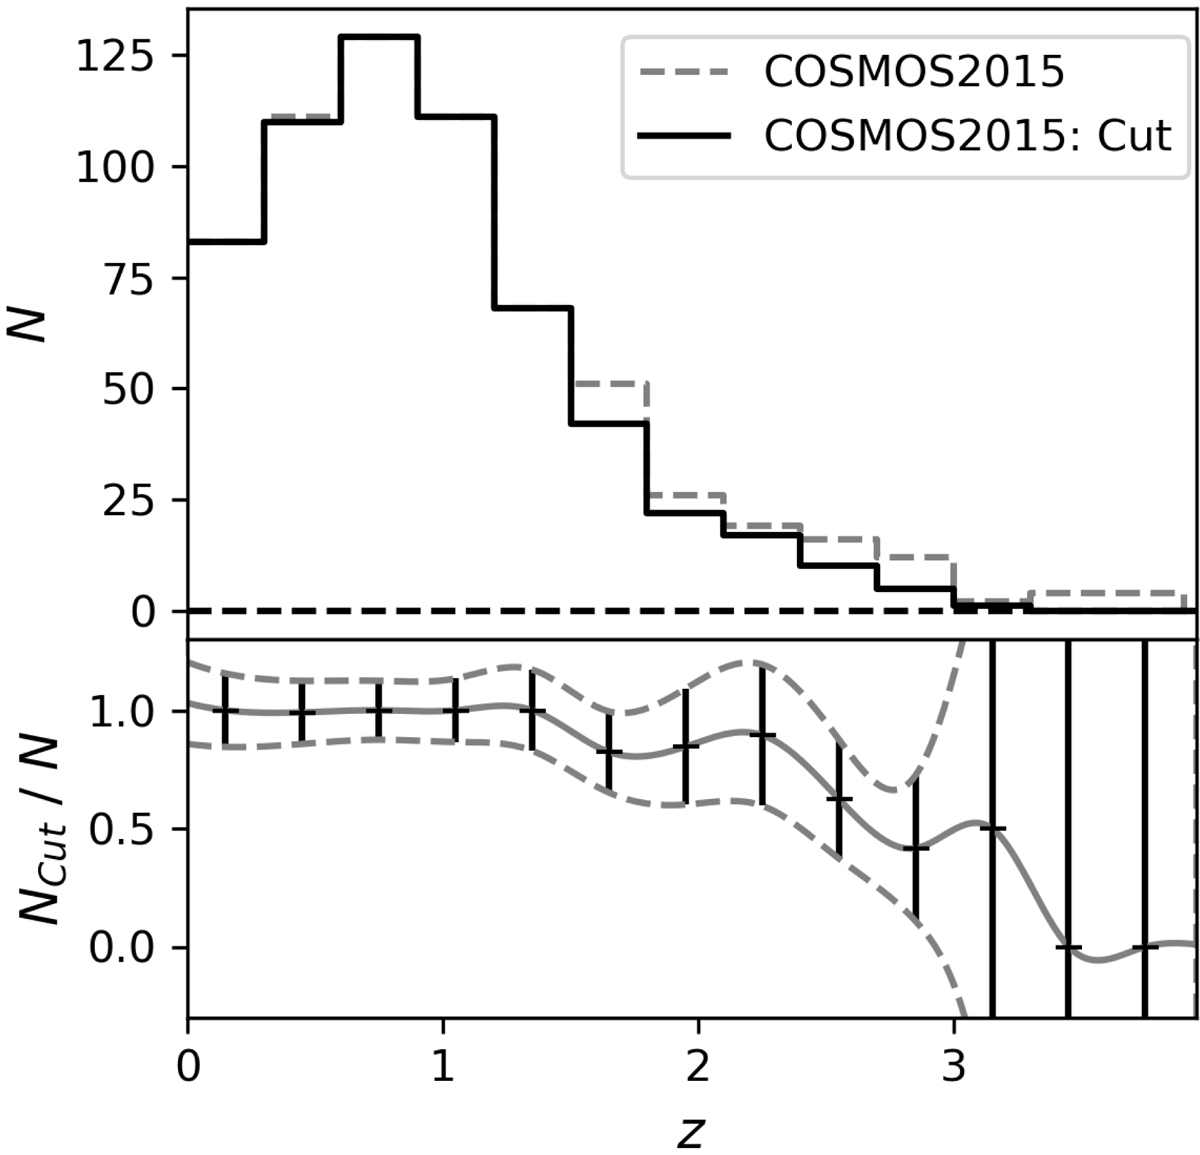
Upper panel: redshift histograms of the COSMOS2015 catalog with the radio cut (dashed gray line) and the histogram with an additional cut in the infrared flux corresponding to the IRAC detection limit of our survey (black line). Bottom panel: ratio of these two histograms to the corresponding standard deviation. A cubic interpolation has been performed on both the data points and the error bars.
Current usage metrics show cumulative count of Article Views (full-text article views including HTML views, PDF and ePub downloads, according to the available data) and Abstracts Views on Vision4Press platform.
Data correspond to usage on the plateform after 2015. The current usage metrics is available 48-96 hours after online publication and is updated daily on week days.
Initial download of the metrics may take a while.