Fig. 5.
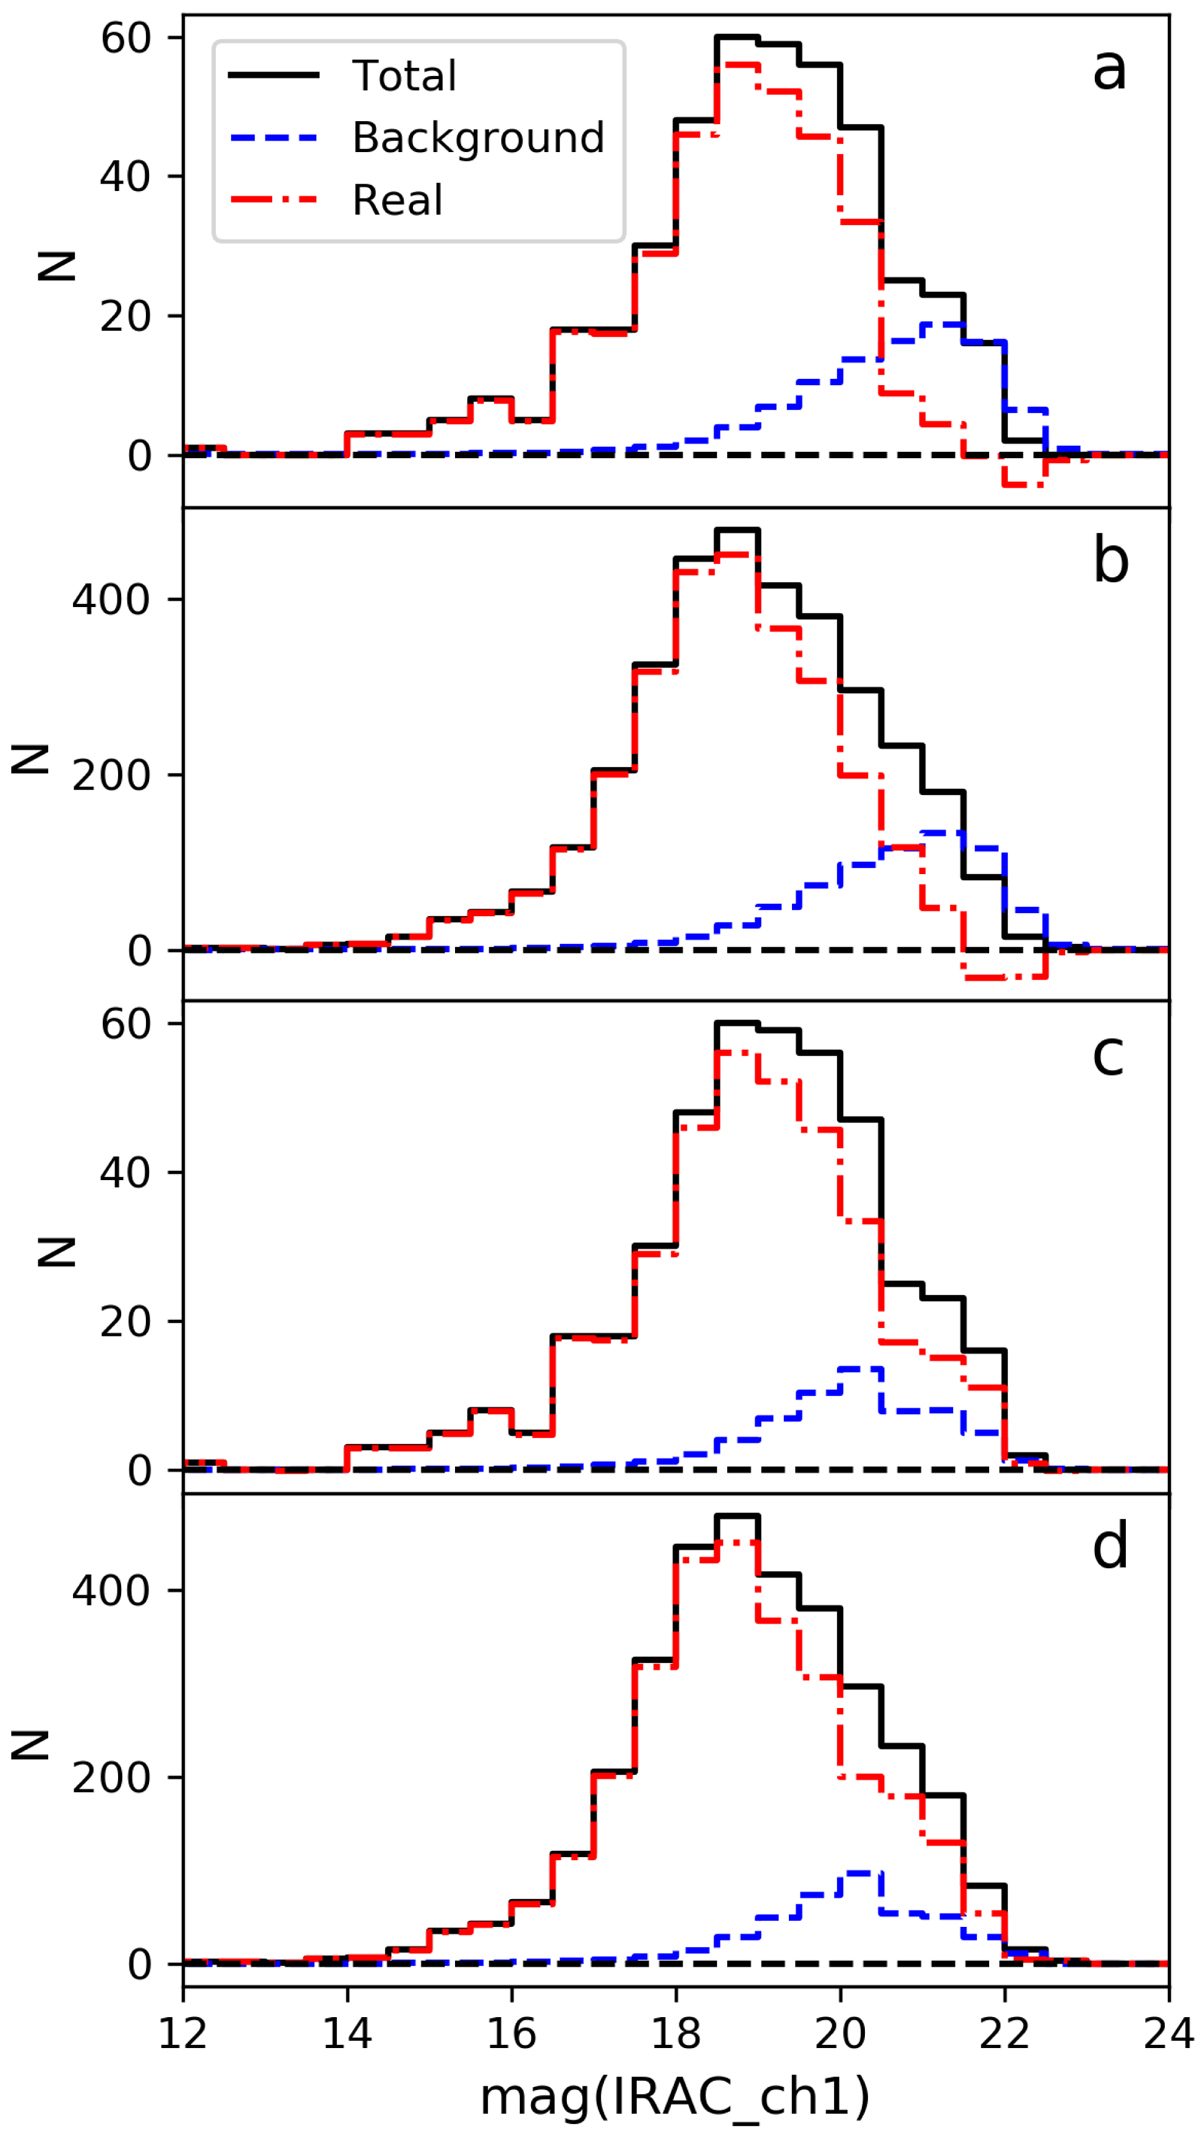
Magnitude distribution of sources during the matching process. The black, blue, and red lines denote the total, background, and real sources, respectively, as described in the text. The two upper histograms (panels a and b, for the inner and outer part of the field, respectively) correspond to the match where the blocking effect is present. Correction for blocking effects mitigates the issue of negative counts. The two bottom histograms (panels c and d, for the inner and outer part of the field, respectively) are the magnitude distributions after the blocking effect has been accounted for.
Current usage metrics show cumulative count of Article Views (full-text article views including HTML views, PDF and ePub downloads, according to the available data) and Abstracts Views on Vision4Press platform.
Data correspond to usage on the plateform after 2015. The current usage metrics is available 48-96 hours after online publication and is updated daily on week days.
Initial download of the metrics may take a while.