Fig. 4.
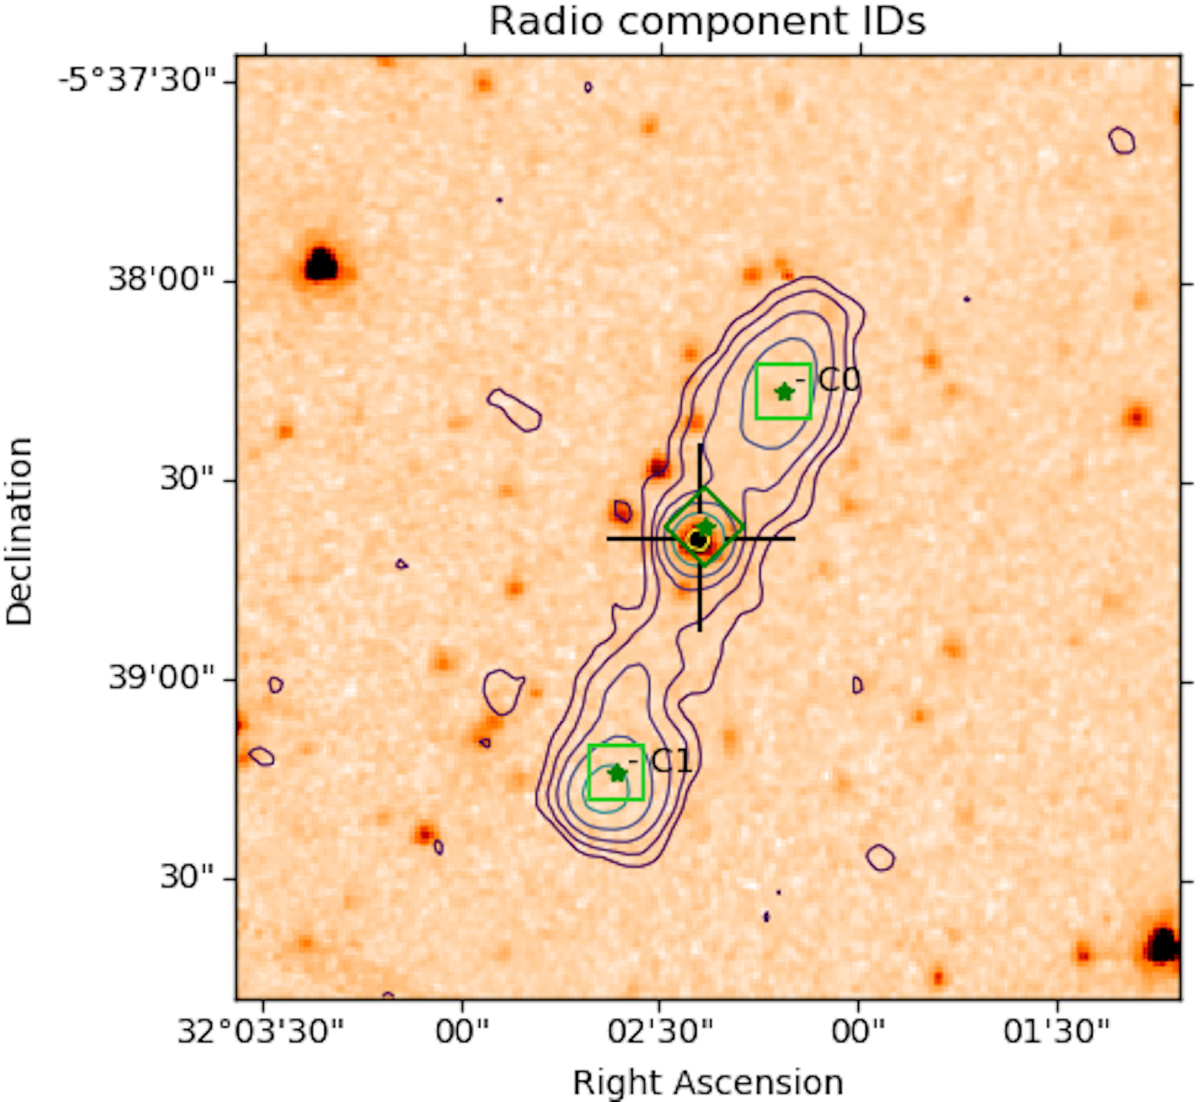
Example of the image created by the MCVCM program. The radio contours (chosen as 2n × rms, n = 1, 2, 3…) are overlaid on the IRAC image. The radio and IRAC selection is performed visually. The black crosshair denotes the IRAC counterpart position. The dark green rhomboid denotes the radio core position, while the light green squares denote the center of the radio lobes.
Current usage metrics show cumulative count of Article Views (full-text article views including HTML views, PDF and ePub downloads, according to the available data) and Abstracts Views on Vision4Press platform.
Data correspond to usage on the plateform after 2015. The current usage metrics is available 48-96 hours after online publication and is updated daily on week days.
Initial download of the metrics may take a while.