Free Access
Fig. 3.
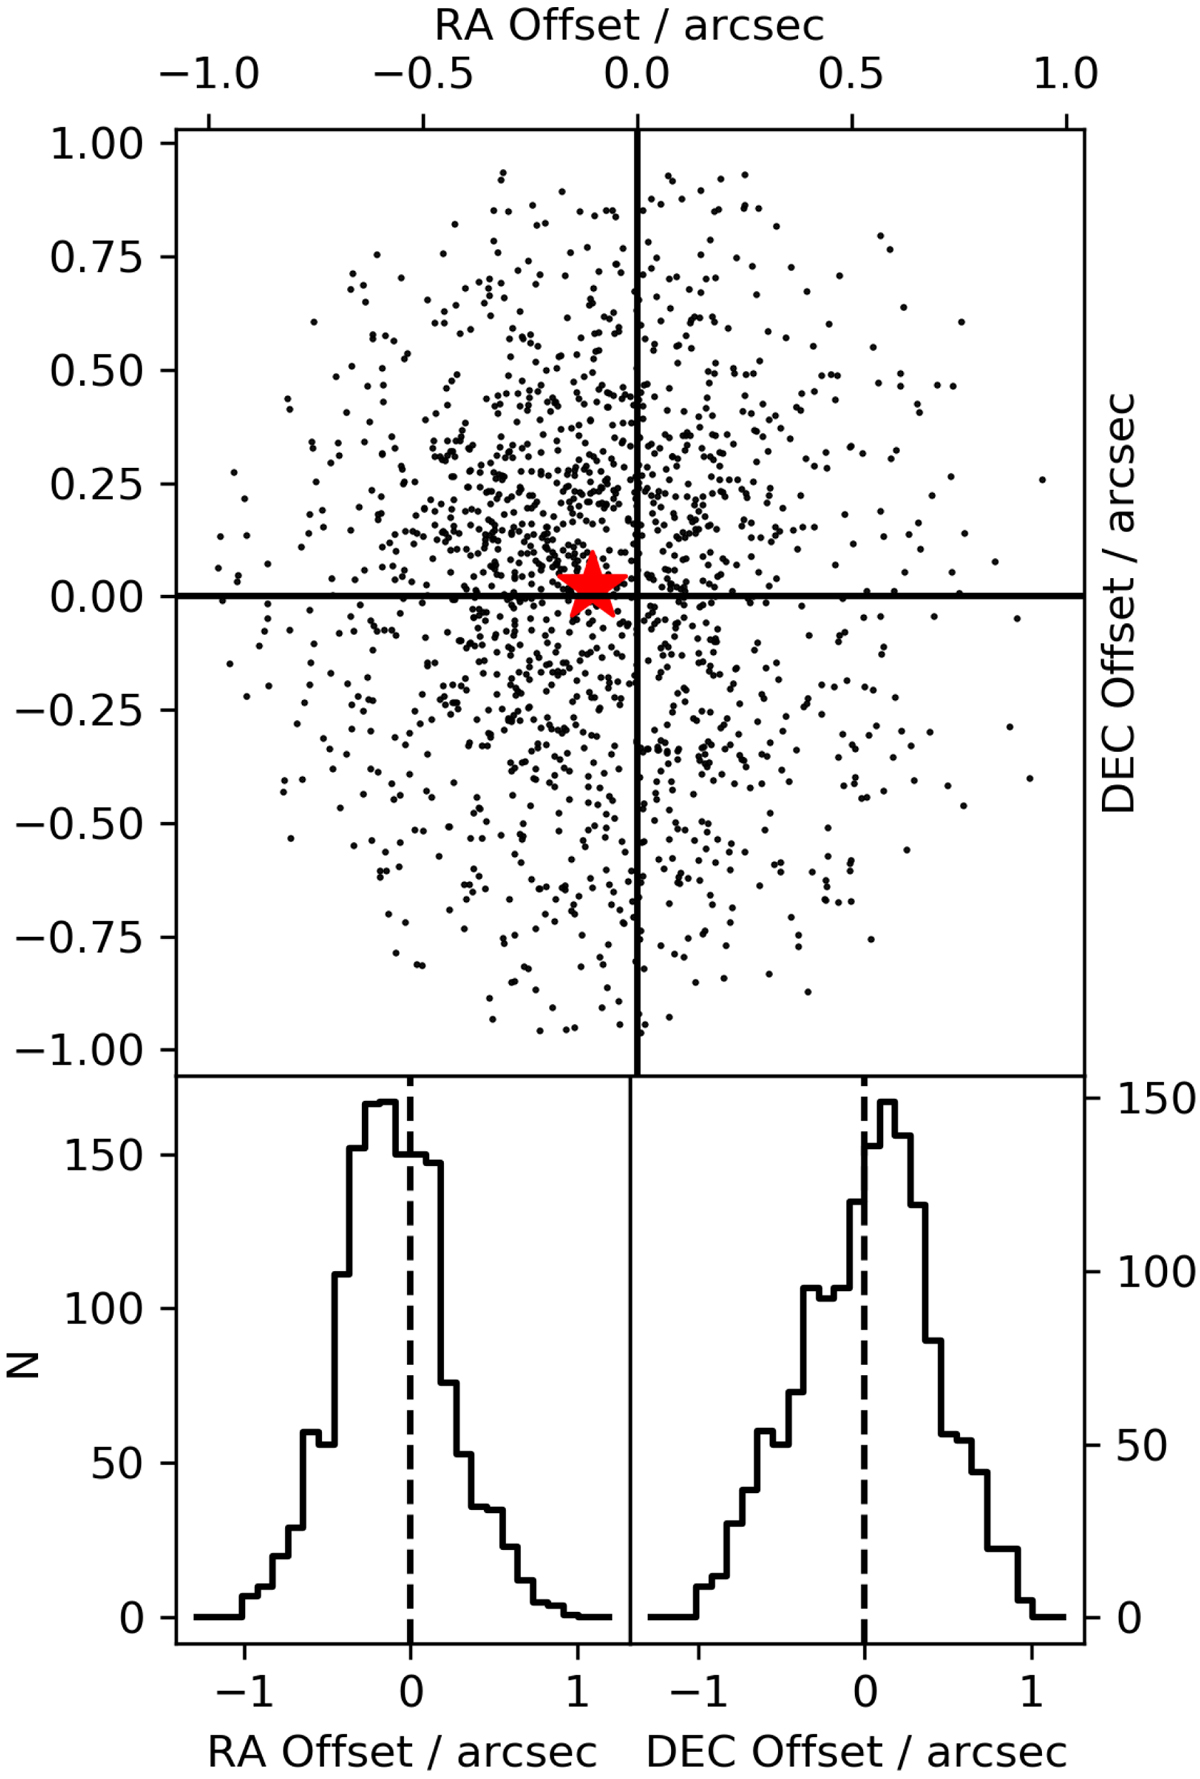
Astrometric offsets between the GMRT and IRAC surveys for the outer part of the XXL-North field. The mean offset is denoted by a red star. The histograms in the bottom panels represent the distribution of offsets in the RA and Dec directions. The inner part of the XXL-North field produces a consistent plot.
Current usage metrics show cumulative count of Article Views (full-text article views including HTML views, PDF and ePub downloads, according to the available data) and Abstracts Views on Vision4Press platform.
Data correspond to usage on the plateform after 2015. The current usage metrics is available 48-96 hours after online publication and is updated daily on week days.
Initial download of the metrics may take a while.