Fig. 2.
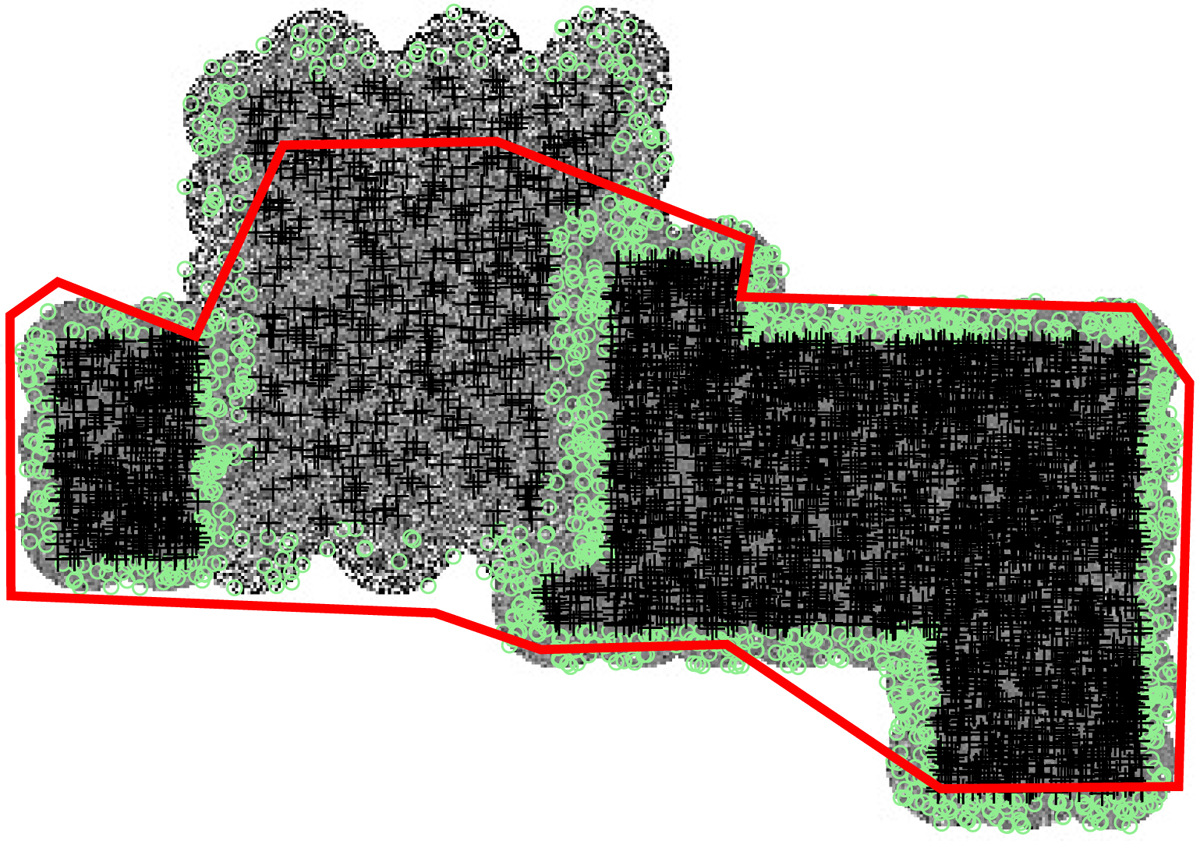
Spitzer IRAC 3.6 μm coverage of the XXL-North field. The gray map corresponds to the GMRT 610 MHz mosaic. The red region denotes the IRAC data. The largest mismatch occurs in the inner part of the radio field, where the number of sources is lower. The sources in the radio catalog are denoted by green circles and black crosses. Sources marked by green symbols correspond to the noisy edges, as described in the text.
Current usage metrics show cumulative count of Article Views (full-text article views including HTML views, PDF and ePub downloads, according to the available data) and Abstracts Views on Vision4Press platform.
Data correspond to usage on the plateform after 2015. The current usage metrics is available 48-96 hours after online publication and is updated daily on week days.
Initial download of the metrics may take a while.