Fig. 1.
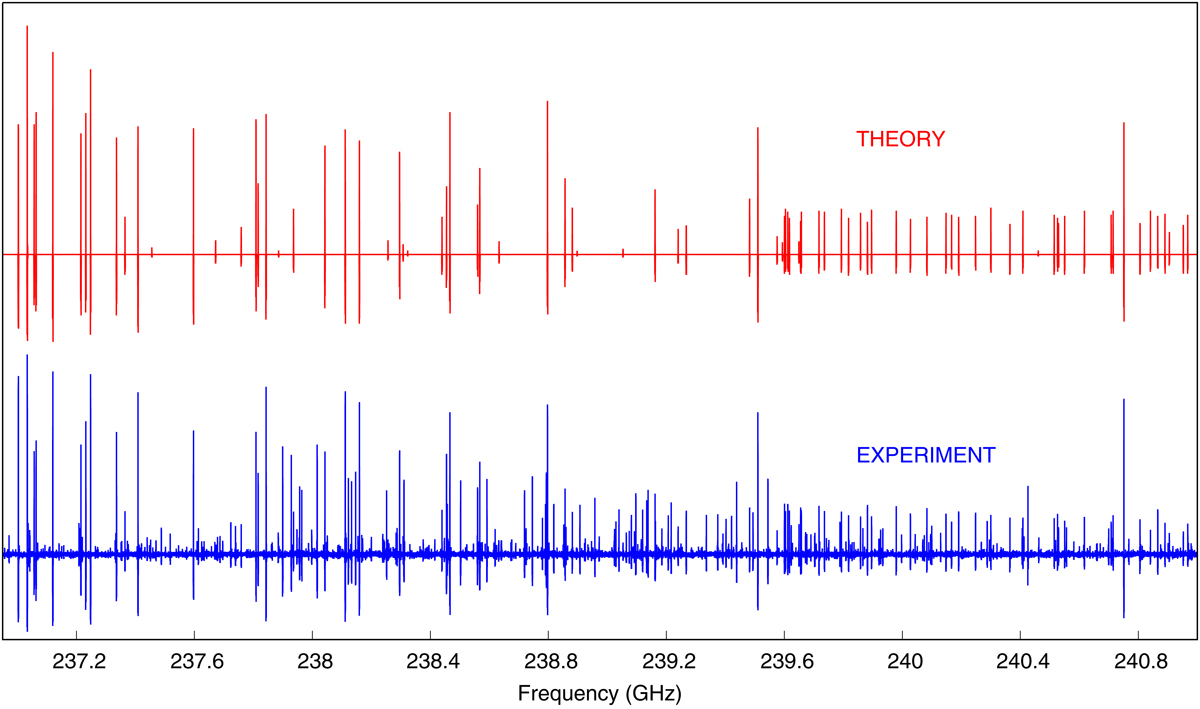
Predicted (in red) and observed (in blue) rotational spectrum of NC–CH=C=O between 236.9 and 241.3 GHz. The low-frequency region of the spectrum shown here is dominated by a series of R-type transitions, J = 44–43, while the high-frequency region is dominated by a series of Q-type transitions, Ka = 5–4. The slight inconsistency between predicted and observed spectrum intensities is due to source power and detector sensitivity variations.
Current usage metrics show cumulative count of Article Views (full-text article views including HTML views, PDF and ePub downloads, according to the available data) and Abstracts Views on Vision4Press platform.
Data correspond to usage on the plateform after 2015. The current usage metrics is available 48-96 hours after online publication and is updated daily on week days.
Initial download of the metrics may take a while.