Fig. 16
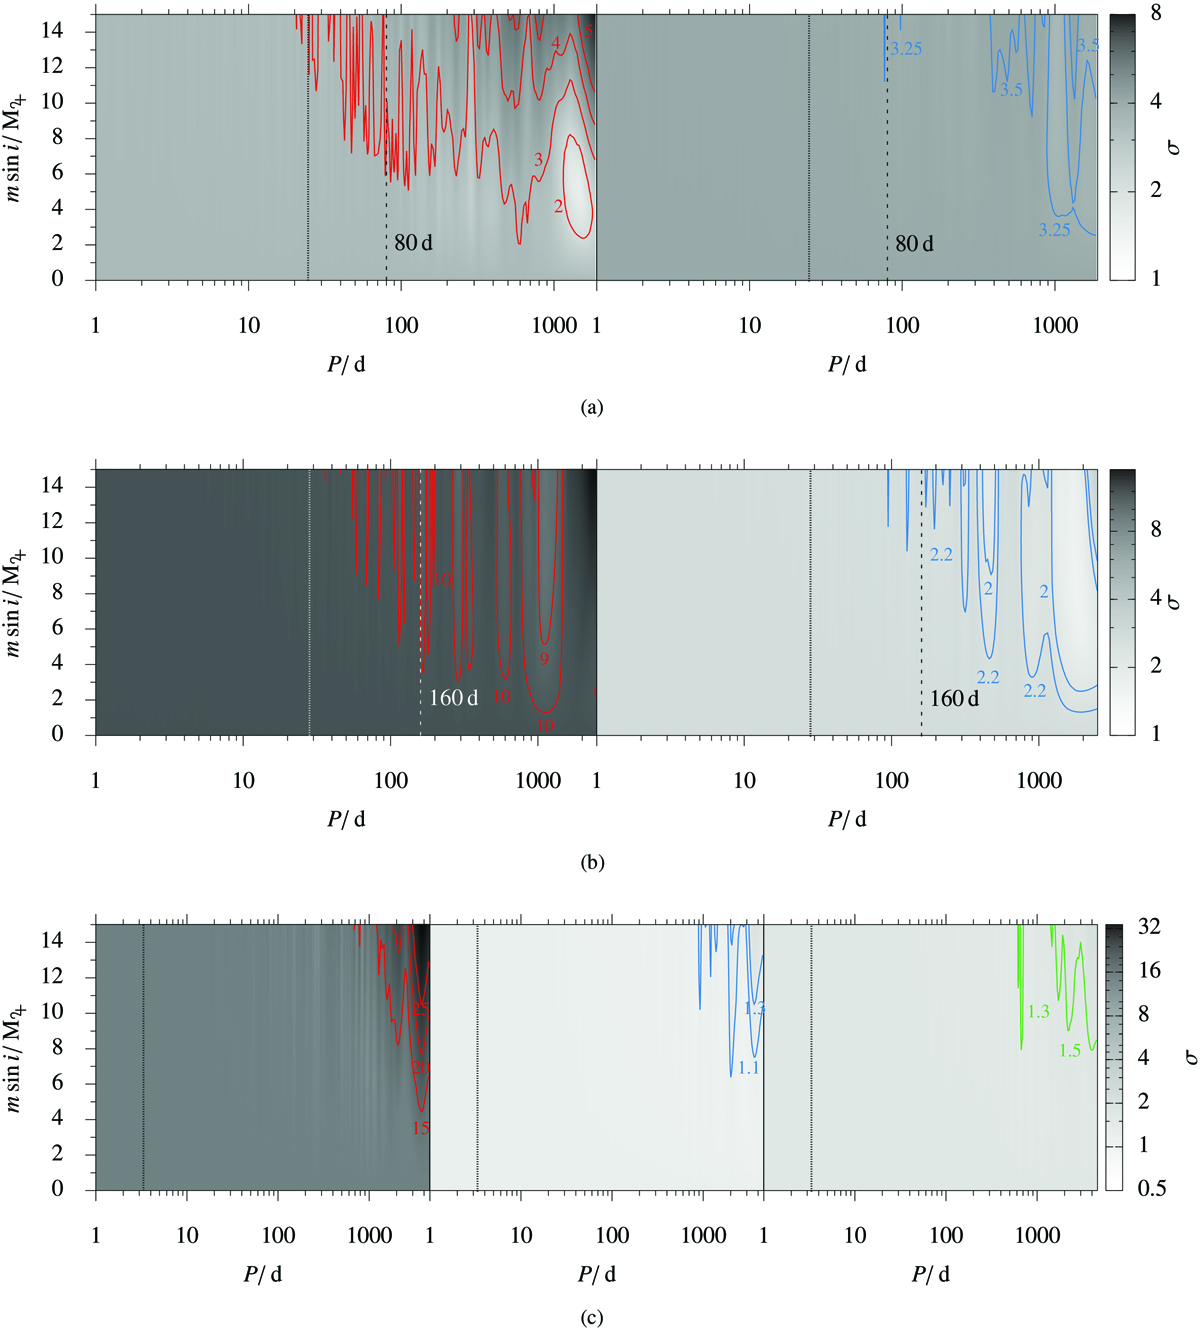
Minimum companion mass as a function of orbital period. Greyscale shows the difference between the O–C measurements and artificial O–C data generated for a given combination of companion mass and orbit. We note that at this stage, the phase optimisation of the artificial data is done independently for each pulsation frequency. The median of gaps in between the epochs is indicated by a vertical dotted line. See text for more details. (a) DW Lyn. Contour lines for f1 are placed at2, 3, 4, and 5 σ (left panel), and for f2 at 3.25 and 3.5 σ (right panel), as indicated by their labels. The planetary signal proposed by Lutz et al. (2011) at a period of 80 d is indicated as dashed line. (b) V1636 Ori. Contour lines for f1 are placed at9 and 10 σ (left panel), and for f2 at 2 and 2.2 σ (right panel), as indicated by their labels. The planetary signal proposed by Lutz et al. (2011) at a period of 160 d is indicated as dashed line. (c) QQ Vir. Contour lines for f1 are placed at15, 20, and 25 σ (left panel), for f2 at 1.1 and 1.3 σ (middle panel), and for f3 at 1.3 and 1.5 σ (right panel), as indicated by their labels.
Current usage metrics show cumulative count of Article Views (full-text article views including HTML views, PDF and ePub downloads, according to the available data) and Abstracts Views on Vision4Press platform.
Data correspond to usage on the plateform after 2015. The current usage metrics is available 48-96 hours after online publication and is updated daily on week days.
Initial download of the metrics may take a while.