Free Access
Fig. 7
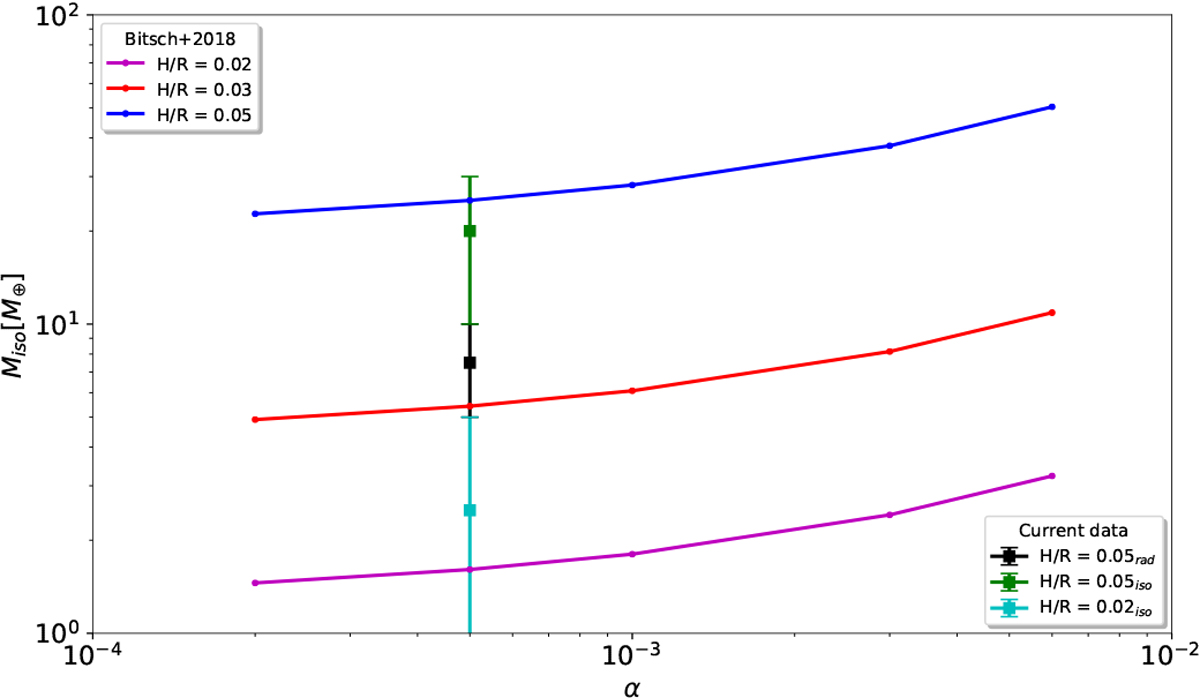
Pebble-isolation mass as a function of α and for different aspect ratios H∕R. The lines show the pebble isolation mass for different α values and they follow the fit from Bitsch et al. (2018). Squares and error bars correspond to the data from Picogna et al. (2018) and the new models with radiative transfer.
Current usage metrics show cumulative count of Article Views (full-text article views including HTML views, PDF and ePub downloads, according to the available data) and Abstracts Views on Vision4Press platform.
Data correspond to usage on the plateform after 2015. The current usage metrics is available 48-96 hours after online publication and is updated daily on week days.
Initial download of the metrics may take a while.