Fig. 2
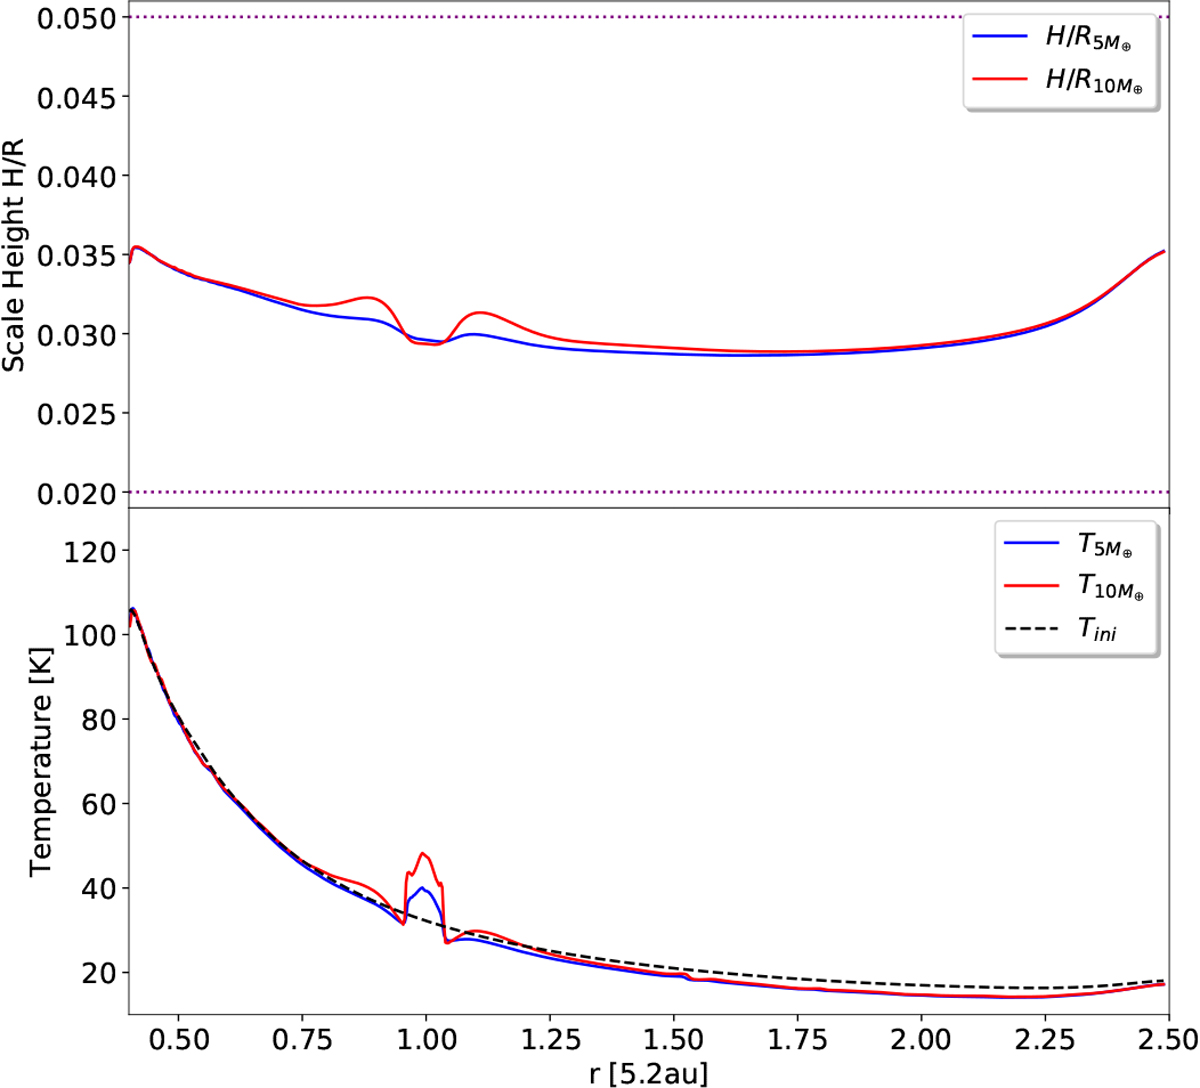
Upper panel: disk scale height (H∕R, solid lines) as a function of radius for the different planetary masses, 5 M⊕ (blue) and 10 M⊕ (red), for themodels with radiative transfer. The purple dotted lines at 0.05 and 0.02 represent the H∕R of the isothermal simulations performed, respectively. Lower panel: midplane gas temperature (T, solid lines) for the corresponding models as on the top panel. The black dashed line represents the initial temperature.
Current usage metrics show cumulative count of Article Views (full-text article views including HTML views, PDF and ePub downloads, according to the available data) and Abstracts Views on Vision4Press platform.
Data correspond to usage on the plateform after 2015. The current usage metrics is available 48-96 hours after online publication and is updated daily on week days.
Initial download of the metrics may take a while.