Fig. 9.
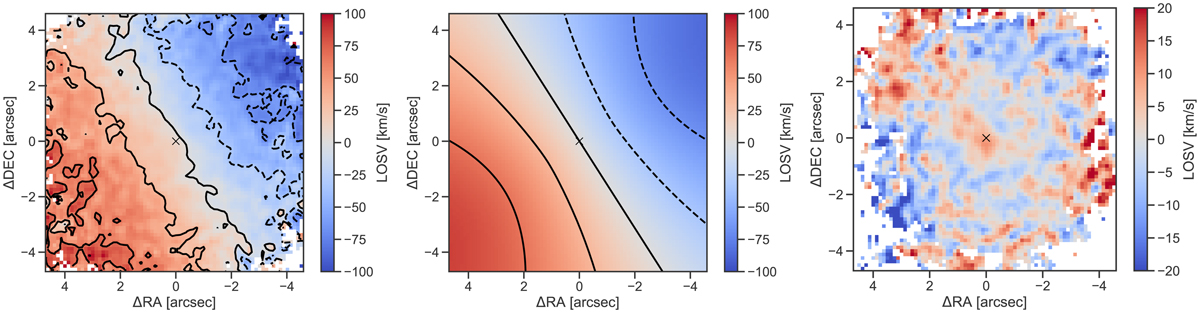
Left: stellar velocity field map derived from fitting the spectral region around the CO(2–0) band head at ∼2.29 μm. Middle: model of the LOSV, assuming circular motions in a Plummer gravitational potential. Right: residuals after subtracting the model from the observed LOSV field. The systemic velocity derived in the model fit is subtracted from the maps. North is up and east is to the left.
Current usage metrics show cumulative count of Article Views (full-text article views including HTML views, PDF and ePub downloads, according to the available data) and Abstracts Views on Vision4Press platform.
Data correspond to usage on the plateform after 2015. The current usage metrics is available 48-96 hours after online publication and is updated daily on week days.
Initial download of the metrics may take a while.