Fig. 6.
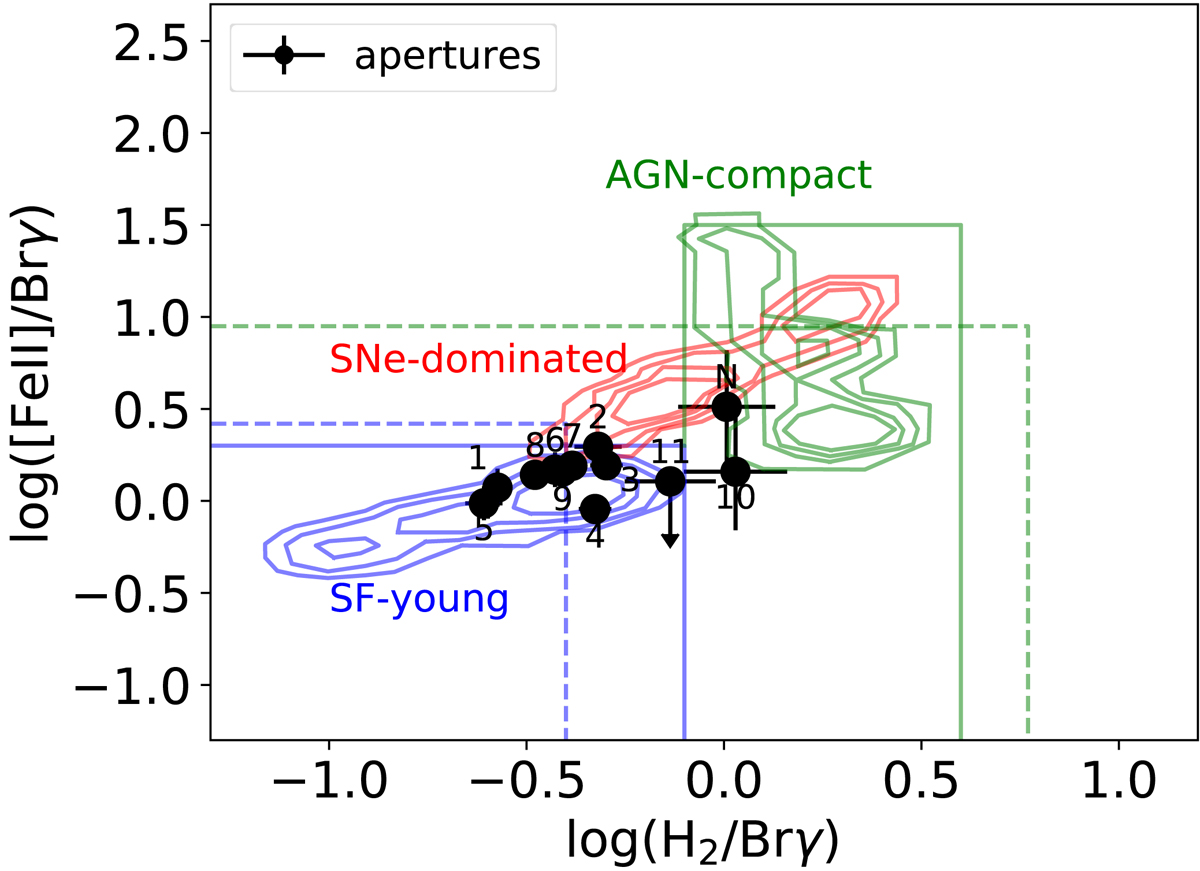
Diagnostic diagram of the apertures in the central kiloparsec of NGC 1672. The locations of the apertures are indicated in the flux maps in Fig. 3. The flux ratios of the H2(1–0)S(1)λ2.122 μm/Brγ and [Fe II]λ1.644 μm/Brγ emission lines are used. The contours show the demarcation for young star formation, supernovae, and compact AGN; the solid lines denote upper limits for young star formation and AGN, both from Colina et al. (2015), derived using IFS data. The dashed lines denote upper limits for star formation and AGN activity (derived from slit-spectroscopy; Riffel et al. 2013b). An upper limit value for the [Fe II] flux was calculated for aperture 11.
Current usage metrics show cumulative count of Article Views (full-text article views including HTML views, PDF and ePub downloads, according to the available data) and Abstracts Views on Vision4Press platform.
Data correspond to usage on the plateform after 2015. The current usage metrics is available 48-96 hours after online publication and is updated daily on week days.
Initial download of the metrics may take a while.