Fig. 3.
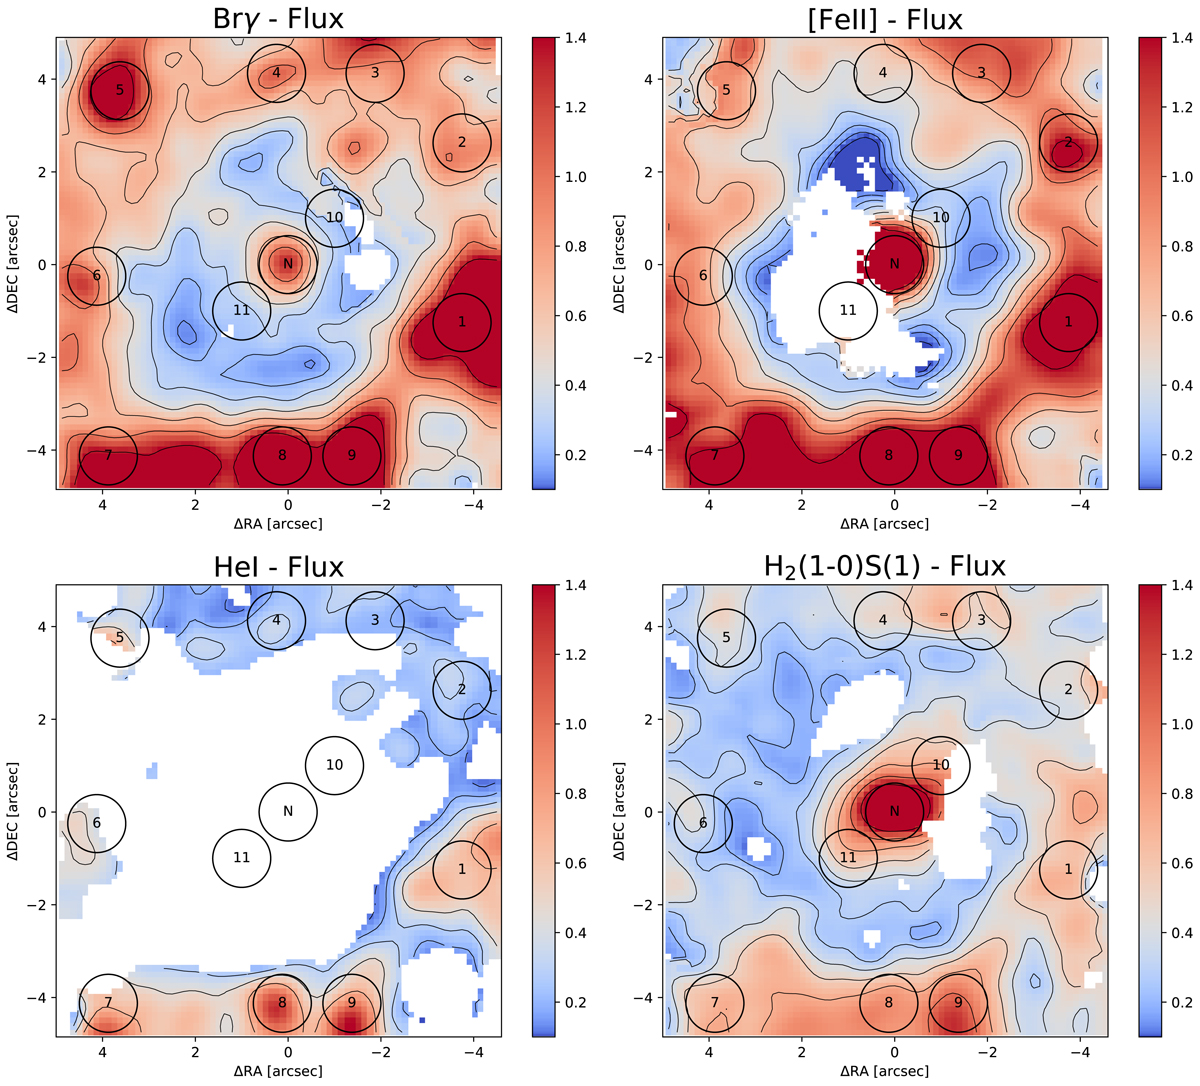
Results of emission line fitting for the inner region of NGC 1672 using a single Gaussian component. From top left to bottom right: flux maps of Brγ λ2.166 μm, [Fe II] λ1.644 μm, H2λ2.12 μm, and He I emission lines. In all of the maps the flux units are 10−20 W m−2. All spatial pixels for which the uncertainty of the emission line fit is higher than 30% are clipped. These pixels are shown in white. North is up and east is to the left.
Current usage metrics show cumulative count of Article Views (full-text article views including HTML views, PDF and ePub downloads, according to the available data) and Abstracts Views on Vision4Press platform.
Data correspond to usage on the plateform after 2015. The current usage metrics is available 48-96 hours after online publication and is updated daily on week days.
Initial download of the metrics may take a while.