Fig. 2.
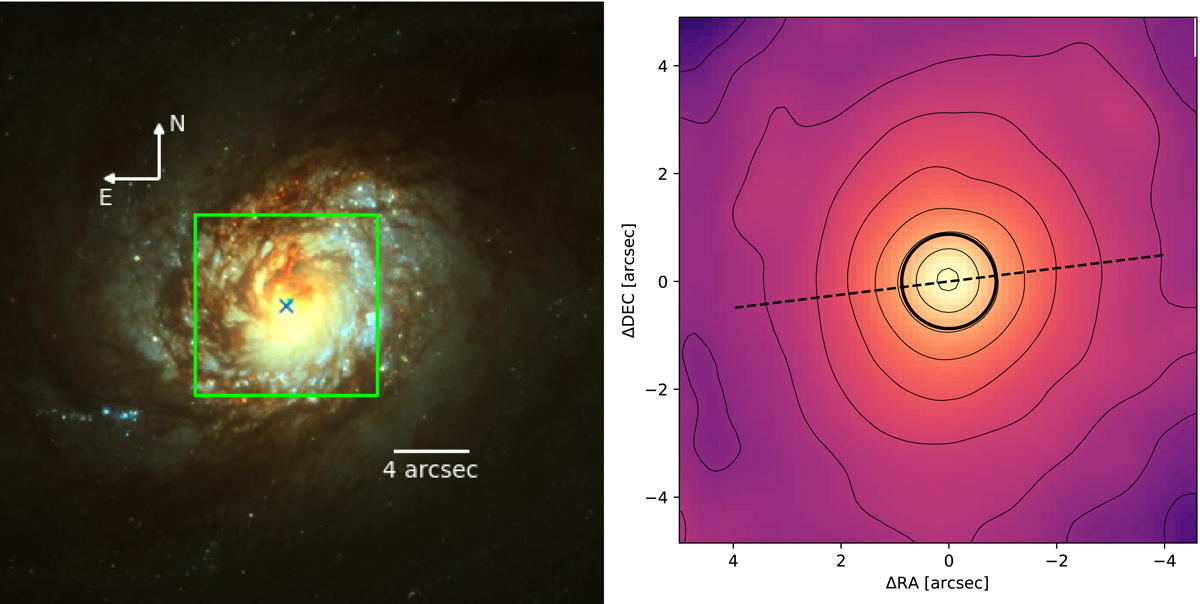
Left: HST/ACS composite image of the central region of NGC 1672 (red: F814W, green: F555W, blue: F435W). The green box indicates the FOV of our SINFONI observations. Right: K-band continuum extracted from the SINFONI data cube, by taking the median of the spectrum around λ ∼ 2.15 μm (extracted from the H + K data cube). The thicker black circle denotes the ![]() . The dashed line indicates the orientation of the large-scale bar.
. The dashed line indicates the orientation of the large-scale bar.
Current usage metrics show cumulative count of Article Views (full-text article views including HTML views, PDF and ePub downloads, according to the available data) and Abstracts Views on Vision4Press platform.
Data correspond to usage on the plateform after 2015. The current usage metrics is available 48-96 hours after online publication and is updated daily on week days.
Initial download of the metrics may take a while.